


Since our last report oil prices remained relatively stable. In today’s report we are to have a look at some key issues that tend to tantalise oil traders, primarily related to the demand and supply of the international wti market. We are to compliment the fundamentals with a technical analysis of WTI’s daily chart.
US oil market signals tightness
Should an oil trader take a look at the status of the US wti market, he/she will observe a relative tightness. We make a start by noting that Baker Hughes reported an increase of active oil rigs in the US by three, with the release implying that a widening of oil demand in the US, forced wti producers to reactivate rigs in order to keep up. On Wednesday, EIA reported a drawdown in US oil inventories of -4.304 million barrels, a drawdown that is wider than the one reported last week of -2.795M.
Also API earlier reported a substantial drawdown of -3.3 million barrels, with both agencies implying with their reports that aggregated oil demand in the US was able to surpass oil production levels thus aligning with the Baker Hughes indicator, indicating a relative tightness of the US oil market. A possible continuation of such signals could provide support for wti prices in the coming week.
Yet at this point we should also note that EIA reported an increase of distillates stocks, which may imply an easing of demand thus in the coming week we may see an easing of the US oil market’s tightness.
OPEC and Canadian wildfires could affect wti supply
On the supply side of the international oil market, we note the possible increase of OPEC wti production as a factor which could weigh on oil prices. The wti producing cartel decided another big increase of oil production equal to 411k bpd.
It’s as if the name of the game has shifted from price to market share for OPEC’s member’s especially Saudi Arabia. Sources of Reuters mentioned that discussions within OPEC+ were for an even higher oil output hike, which tends to be implying further increases in oil production in the coming months.
Should the market expectations for an increase of oil production by OPEC+ intensify, we may see them weighing on wti prices as oil’s supply strains would ease. Furthermore we also note the wildfires tormenting Canada at the current stage as a factor that could tighten oil supply thus support wti prices.
Yet reports tend to show that rain has put out some of the fires, thus allowing for the output to be restored and easing the danger that was threatening oil production. Thus we may see a possible easing of market worries for the possible effect of Canadian wildfires on oil production, which in turn may also weigh on oil prices.
Easing of Manufacturing activity may lower oil demand
We tend to have some worries for the easing of economic activity in China’s and US manufacturing sectors and their possible adverse effect on wti demand. It’s characteristic that China’s manufacturing PMI figures for May were below the reading of 50, implying a contraction of economic activity in the sector for the past month.
Across the Pacific, the US manufacturing sector also suffered a decrease of economic activity as the US ISM manufacturing PMI figure despite being allready below the reading of 50, unexpectedly dropped even lower.
Also the US factory orders growth rate dropped below the zero, implying a reduction and darkening the outlook of the US manufacturing sector. The contraction of economic activity in the US and China could adversely affect oil demand which in turn could weigh on oil prices.
Tomorrow we note the release of the US employment report for May yet we tend to place more attention on a deeper fundamental issue, namely the trade tensions from Trump’s tariffs, and despite the relative saturation of the subject, any escalation of trading tensions could weigh on oil prices and vice versa.
Oil Technical Analysis
WTI Cash Daily Chart
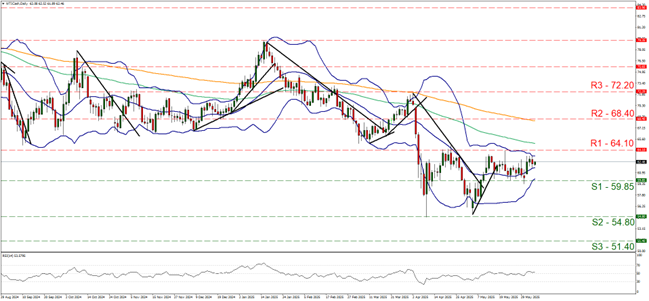
- Support: 59.85 (S1), 54.80 (S2), 51.40 (S3)
- Resistance: 64.10 (R1), 68.40 (R2), 72.20 (R3)
WTI’s price, despite some ups and downs since our last report remained relatively unchanged over the past week. Hence we currently maintain a bias for the sideways motion of the commodity’s price to be maintained between the 64.10 (R1) and the 59.85 (S1) support level.
Please note the RSI indicator that remains near the reading of 50, implying a relative indecisiveness on behalf of market participants for the direction of WTI’s price action. Furthermore the Bollinger bands have narrowed substantially implying less volatility for the commodity’s price, which in turn could allow the sideways motion to be maintained.
Should the bulls take over we may see WTI’s price breaking the 64.10 (R1) resistance line and start aiming for the 68.40 (R2) resistance level. Should the bears be in charge of WTI’s price action, we may see it breaking the 59.85 (s1) support line, thus paving the way for the 54.80 (S2) support level.
Avertissement :
Ces informations ne doivent pas être considérées comme un conseil ou une recommandation d'investissement, mais uniquement comme une communication marketing


