

Since our last report, oil prices were in a free fall until yesterday after reaching levels not seen since the pandemic. The threat posed by Trump’s tariffs on oil’s demand outlook was substantial, while we have to note that also the supply side tends to imply a loosening of the international oil market. Today besides the prementioned points we are also to have a look at the shift in the US oil market and conclude the report with a technical analysis of WTI’s daily chart.
Trump’s tariffs caused a seismic shift for oil prices
It may have been more than obvious over the past week how Trump’s tariffs affected the market’s perception of the demand outlook of oil. For the record, Trump imposed a blanket tariff of 10% practically on all goods entering US soil while there were additional tariffs on products from targeted countries, among which practically raised tariffs on Chinese products to 54% and China responded with tariffs on US products of 34%.
The US then responded with additional tariffs of 50%, raising aggregated tariffs on Chinese products to a staggering 104%, with the Chinese quickly responding raising tariffs to US products to the level of 84%. At the time the EU was also considering its own response to the US tariffs. The developments of the ongoing trade war on a global level, understandably undermined the outlook for oil demand, as there were wide expectations for an economic slowdown and subsequently also a slowdown in shipping.
Yet yesterday in a stunning U-turn, US President Trump in a post, announced a 90-day pause in a substantial part of the tariffs imposed on products entering the US from several targeted countries. It should be noted that the 10% generic tariff remains in effect.
On the flip side the trade war on China intensified further as the US President in the same post, also stated that the US tariffs on Chinese products are to be raised to an aggregated 125%, “effective immediately”. The latest development allowed for a correction higher of oil prices, as market worries tended to ease. In a more general note, we expect further developments on the issue that could influence oil prices either way.
Any escalation of the trade war could weigh on oil prices and vice versa any further easing of market worries could play a supportive role.
OPEC’s production levels
As mentioned in last week’s report, OPEC+ agreed to advance their plan for oil output hikes, with OPEC stating that they will be increasing oil output by 411,000 barrels per day in May. Such a development tends to weigh on wti prices, as the supply of oil increases for the international markets. Yet latest news may not be so optimistic for oil supply, as OPEC’s output was less than expected with Iran, Nigeria and Venezuela missing their target production levels by an aggregated 150k barrels which may be tightening the supply side of the wti market. On the flip side Kazakhstan is reported to have reached record-high oil production levels in March easing he tension of wti supply. We intend to continue the tight monitoring of oil production levels and we consider that any signals of increased oil production could weigh on oil prices and vice versa.
Mixed signals from the US oil market
The US oil market tended to send out mixed signals for the oil market. Starting last Friday and as per Baker Hughes, active oil rigs in the US increased by four, which tended to imply a possible increase of demand in the US oil market which was a positive.
The positive signals intensified as API reported an unexpected drawdown in US oil inventories on Tuesday, implying that wti production levels were not able to catch up with aggregated demand in the US oil market. Yet on Wednesday EIA reported a narrowed increase of US wti inventories, which despite the rise as such being narrower than the prior week’s, it still implied that production levels exceeded oil demand levels in the US.
Should we see increased signs of a tightening US oil market in the coming week, we may see it having a beneficial effect on oil prices.
Oil Technical Analysis
WTI Cash Daily Chart
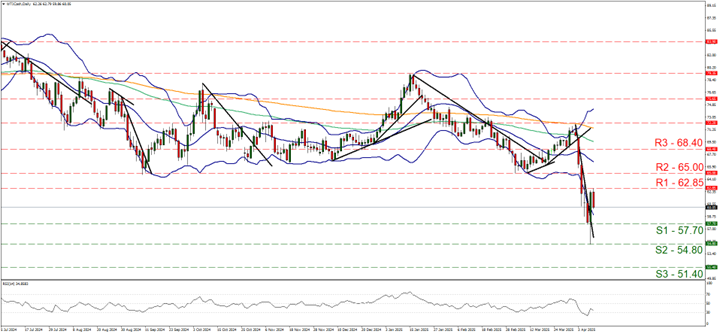
- Support: 57.70 (S1), 54.80 (S2), 51.40 (S3)
- Resistance: 62.85 (R1), 65.00 (R2), 68.40 (R3)
WTI’s price action tumbled over the past week, hitting a low point at the 54.80 (S2) support level, before correcting higher and hitting a ceiling at the 62.85 (R1) resistance level and correcting lower once again. We tend to expect a relative stabilisation of the commodity’s price as its intense downward motion was interrupted.
Yet at the same time we also note that there seems to be a bearish predisposition for WTI by market participants as the RSI indicator, despite a correction higher after a wide drop, remains close to the reading of 30. For a renewal of the bearish outlook we would require the black gold’s price to breach the 57.70 (S1) support line and aim if not breach the 54.80 (S2) support level.
On the flip side, for bullish outlook we would require WTI’s price to break the 57.70 (R1) resistance line and start aiming if not breaching the 65.00 (R2) resistance level.
Avertissement :
Ces informations ne doivent pas être considérées comme un conseil ou une recommandation d'investissement, mais uniquement comme une communication marketing


