
WTI saw its winning streak snap yesterday, after disappointing data stemming from the US rekindled worries for an impending recession. On the other hand, persistent optimism for increased consumption levels from China seemed to provide a floor under crude prices, despite surging covid cases and grim growth outlooks. Another large, unexpected buildup in crude inventories may have put some pressure on WTI and today energy traders await for an update from EIA stocks. In this report we aim to shed light on the catalysts driving WTI’s price, assess its future outlook and conclude with a technical analysis.
Recession worries outweighed China’s reopening optimism
Crude oil pared early gains during yesterday’s session after weak economic data in regards to consumer spending و industrial production but also due to repeated hawkish remarks by Fed policy makers. Even though retail sales for the month of December contracted more than expected, proving in a way that the Fed’s tightening efforts are indeed demand destructive, they also increase the probability of US entering a recessionary period. Furthermore, also worrying was the further deterioration of the industrial production rate for the month of December, reporting its second month in a row in the negatives and simultaneously the largest drop since September 2021, practically intensified fears of a slowdown in the world’s largest economy. Adding more salt to injury, were the hawkish comments of St. Louis Fed President Bullard, who continues to reiterate the need for more rate increases, stressed the need for raising the terminal rate north of 5% in order to bring inflation down, closer to the central banks’ 2% target. He later added “we’re almost into a zone that we could call restrictive – we’re not quite there yet” and that the bank should not stall before getting to the end zone. Cleveland Fed President Mester’s speech shared similar characteristics, leaning towards the hawkish side, but refrained from disclosing the magnitude of further hikes. Overall, the intensification of worries for a possible recession and stark comments for more aggressive monetary policy tightening kept energy bulls at bay, pushing them to reconsider their short-term outlooks. The FOMC policymakers will convene on the 1 of February and currently the Feds Fund Futures showcases a 92% probability for a 25-basis points rate hike scenario to materialize.
Crude oil inventory stocks keep piling up
Yesterday the API crude oil inventories marked the third consecutive week of large buildups, as the agency reported another unexpected pile up of 7.6M barrels, exceeding expectations. The EIA weekly crude oil inventories report is pending, and it is expected to hit the market later today. According to estimates the figure is estimated to report a drawdown of -0.5M barrels, yet analysts caution that the result may present an upside surprise, mirroring yesterday’s API results. Last week EIA reported its third largest buildup of crude stocks ever, yet we noted that the effect of the report was dampened by the overwhelmingly optimistic outlooks for China’s reopening, which fueled further WTI’s ascend last week. Should the data indicate another large build up in crude oil inventories later today, we may see WTI relent some ground and fall lower.
تجزیه و تحلیل فنی
WTI Cash H4
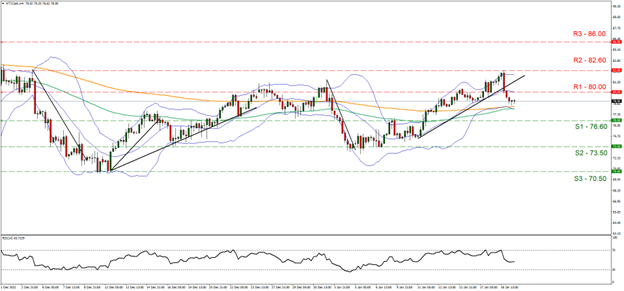
Looking at WTICash 4-hour chart we observe oil prices unable to continue their ascend higher, topping near the 82.60 (R2) level, break below the ascending trendline initiated on the 11 of January and then retracing to lower ground. We hold a sideways bias for the commodity, being confined between 80.00 (R1) resistance and 76.60 (S1) support levels. Supporting our case is the RSI indicator below our 4-hour chart that currently registers a value of 47, signaling indecision surrounding WTI. We also note that the price action may find support near the 100 and 200-period میانگینهای متحرک, which could be interpreted as another signal for temporary consolidation و extension of sideways price movement. Should the bulls take initiative over crude’s direction, we may see the price action rise and break the 80.00 (R1) and move closer to the 82.60 (R2) resistance barrier for a breakout attempt. Should on the hand the bears take over, we may see the price action fall below the 76.60 (S1) support level and move decisively lower towards the 73.50 (S2) support base.
اگر در مورد این مقاله سوال یا نظر ی کلی دارید، لطفاً ایمیل خود را مستقیماً به تیم تحقیقاتی ما بفرستیدresearch_team@ironfx.com
سلب مسئولیت:
This information is not considered investment advice or an investment recommendation, but instead a marketing communication. IronFX is not responsible for any data or information provided by third parties referenced or hyperlinked, in this communication.


