
Crude is on track to end its second week in the reds as the negative sentiment perked up following dismal business activity results from Germany, France, the UK and the US this week, which spark worries for a global economic downturn and stifle demand prospects for the commodity. Weak oil demand expectations have further pressured market sentiment. In this report, we aim to shed light on the factors driving WTI’s price, assess its future outlook and conclude with a technical analysis.
Disappointing manufacturing activity cripples demand for crude oil
Yesterday, a series of dismal preliminary PMI results from Europe, the UK and the US broadcasted once again that the global manufacturing activity trends are facing hurdles, which cloud the prospects for increased demand for the commodity. Weak oil demand expectations have amplified the negative sentiment. The results coincide with last week’s figures from China, whose Industrial Production rates were indicative of an extended deterioration in its manufacturing capabilities, which led traders to dismantle their overoptimistic bullish assessments for a WTI price north of the $83 range and instead start downsizing their positions as the momentum turned bearish. More specifically, the manufacturing activity of the US stagnated in contraction territory for the 4th consecutive month, the UK broadcasted weakness on both the services and manufacturing fronts yet again, and Germany’s manufacturing activity fell to levels last seen at the start of the Covid pandemic, despite posting a better-than-expected figure. The results added negative pressure on WTI and accelerated its fall to the $78 per-barrel level. Now all eyes fall on tomorrow’s Jackson Hole symposium, where central bankers convene to discuss the progress of monetary policy and the state of the economy, and traders are drawing particular attention to Fed Chair Powell’s speech, searching for clues. Should the rhetoric remain hawkish, calling for more hikes for longer, we would expect to see crude’s price extending its fall.
BRICS, the Saudis, the Iranians and the Emirates: An oil-driven alignment
It is no secret that Middle eastern nations have been telegraphing their intents at diversifying their trade partnerships in recent years. Evidently, Saudi Arabia’s posterchild relationship with the US has turned sour particularly under the Biden administration and the Kingdom has diverted its gaze towards the East, engaging in trade deals with the oil-thirsty China and now most populous nation of the world India. Iran has recently announced 67 new oil and gas projects which are worth at around $15 billion and aims to increase production of 3.3 million bpd by the end of August, and to reach 3.5 million by the end of September. Iran’s improved oil production capabilities could come in handy in the long run, now that BRICS have officially invited the nation to join the alliance. Likewise, the UAE was also formally invited to join the ‘global south’ and the prospects for dealmaking with the new emerging powers can bolster production and exports, shall there be an increase in demand.
تجزیه و تحلیل فنی
WTI Cash 4H Chart
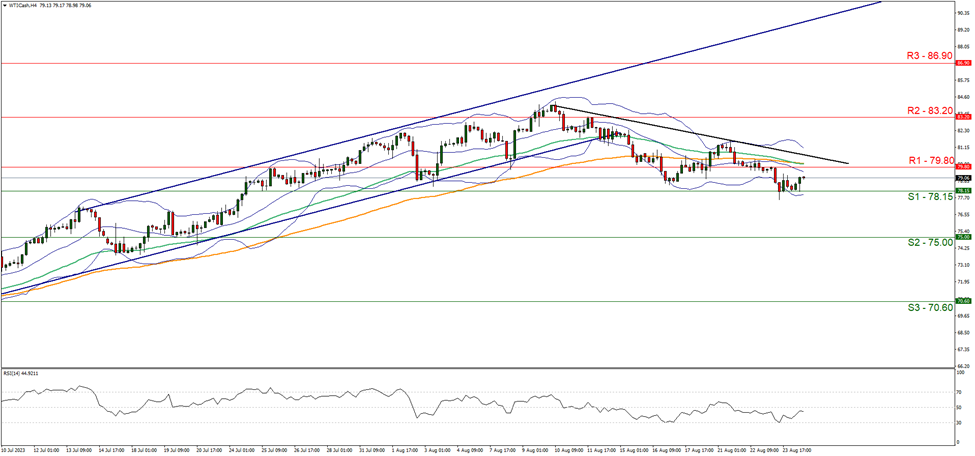
- Support: 78.15 (S1), 75.00 (S2), 70.60 (S3)
- Resistance: 79.80 (R1), 83.20 (R2), 86.90 (R3)
WTI’s price appears to be moving lower for a second week in a row. We tend to maintain a bearish outlook for the liquid gold, and supporting our case is the downward-moving trendline from the 10th of August, in addition to the RSI indicator on our 4-Hour chart currently being slightly below the figure of 50, implying slight bearish market tendencies for oil. For our bearish outlook to continue, we would like to see a clear break below the 78.15 (S1) support level, with the next possible target for the bears being the 75.00 (S2) support base. On the other hand, for a bullish outlook, we would like to see a clear break above the 83.20 (R1) resistance level, with the next possible target for the bulls being the 83.20 (R2) resistance ceiling. Lastly, for a neutral outlook, we would like to see the commodity remaining between the 78.15 (S1) and 83.20 (R1) support and resistance levels, in addition to the RSI indicator remaining near the 50 level.
سلب مسئولیت:
This information is not considered investment advice or an investment recommendation, but instead a marketing communication. IronFX is not responsible for any data or information provided by third parties referenced or hyperlinked, in this communication.
