

Oil prices appear to have remained relatively unchanged compared to last week.
Today we are to take a look at the data of the US oil market and a number of fundamental issues affecting the supply and demand side of the international oil market.
For a rounder view, we are to conclude the report with a technical analysis of WTI’s daily chart.
US oil market data
In the US oil market data tended to send out mixed signals. We make a start with the US Baker Hughes oil rig count, which showed that the number of active oil rigs has dropped by two reaching 477.
The shutting down of two oil rigs tends to imply an easing demand side for the US oil market, which should be considered as bearish for oil prices.
On Tuesday signals for an easing of the US oil market intensified, as the API weekly crude oil inventories figure rose showing an increase of oil inventories by 1.232 million barrels. The release tended to imply that production levels were able to surpass aggregated oil demand in the US market.
On the contrary, EIA reported a substantial drawdown of -5.073 million barrels implying a tightening of the US oil market as the rise of US oil inventories tended to imply that oil production levels did not reach aggregated oil demand levels.
Overall, data on the ground of the US oil market, tended to be inconclusive, yet should we see an alignment of data pointing towards a tightening of the US oil market, we may see oil prices getting some support.
OPEC to delay oil output hike
On the production side of the international oil market, we highlight the report of Reuters about OPEC+ delaying a hike in oil production levels.
According to Reuters, OPEC+ has agreed to delay its plan to raise oil output until April 2025, an OPEC+ source told Reuters while its meeting was underway, to provide additional support for the oil market.
The group will unwind its latest layer of output cuts gradually from April 2025 until 2026, the source said. We see the case for OPEC to delay any production hikes in an effort to see how the demand side will evolving.
Especially about China and the US. Should we see the news be verified we may see bullish pressures for oil prices and vice versa. Please note that OPEC’s meeting is ongoing as we these lines are written hence we may see some volatility for oil prices in the late American session today and tomorrow.
Developments in the Middle East
In the Middle East, we note that the ceasefire agreed between Hezbollah and Israel for Southern Lebanon seems to be holding for now yet at the same time also remains very fragile. On other news, Trump has sent an envoy in the Middle East in an effort to reach a ceasefire in Gaza as well.
According Reuters again Donald Trump’s Middle East envoy has travelled to Qatar and Israel to kickstart the U.S. president-elect’s diplomatic push to help reach a Gaza ceasefire and hostages release deal before he takes office on Jan. 20.
Yet the effort seems to be a double edged sword at the current moment as according to BBC, Trump also threatened Hamas that there will be “all hell to pay” if hostages in Gaza are not released until he is inaugurated on the 20 of January.
We still see the situation as very fluid in the Middle East despite market worries easing. Should we see further easing of market worries, say for example if Trump’s effort seems to find some ground in creating the context for a ceasefire in Gaza and the ceasefire in Southern Lebanon stabilising, then we may see the overall developments in the Middle East weighing on oil prices.
On the other hand, the release of the Israeli hostages by Hamas may prove to be difficult, without a reciprocate movement by Israel to release Palestinian prisoners. Given the unpredictable nature of Hamas and the intense threat of US President elect Donald Trump, the situation may blow once again out of proportion.
Oil Technical Analysis
WTICash Daily Chart
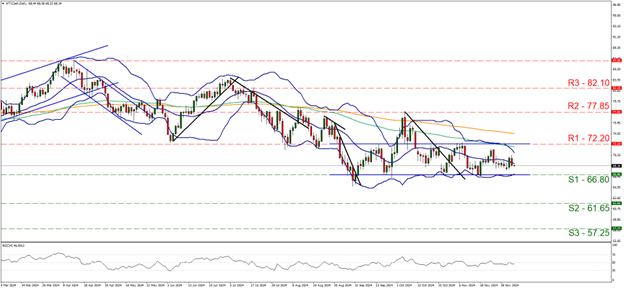
- Support: 66.80 (S1), 61.65 (S2), 57.25 (S3)
- Resistance: 72.20 (R1), 77.85 (R2), 82.10 (R3)
WTI appears to be continuing on its sideways path, remaining confined between the 66.80 (S1) support level and the 72.20 (R1) resistance line.
We opt for a sideways bias for the commodity’s price and supporting our case is the RSI indicator our chart which currently registers a figure just below the reading of 50, implying a neutral market sentiment, in addition to the sideways moving channel which was incepted on the 3
For our sideways movement bias to continue, we would require the commodity’s price to remain confined between the 66.80 (S1) support level and the 72.20 (R1) resistance line.
On the flip side for a bullish outlook, we would require a clear break above the 72.20 (R1) resistance line, with the next possible target for the bulls being the 77.85 (R2) resistance level, while even higher we note the 82.10 (R3) resistance base.
Lastly, for a bearish outlook we would require a clear break below the 66.80 (S1) support level, with the next possible target for the bears being the 61.65 (S2) support base and in an extremely bearish scenario we may see WTI’s price reaching the 57.25 (S3) support barrier which has not seen any price action since April 2021.
سلب مسئولیت:
This information is not considered investment advice or an investment recommendation, but instead a marketing communication. IronFX is not responsible for any data or information provided by third parties referenced or hyperlinked in this communication.


