
The price of WTI has risen in the past few days compared to the last report, yet today’s late European session appeared to have some surprises for oil traders. Today on the fundamental side we take a look at the situation of the US market and then continue to examine the demand side as well as the supply side of oil. The report is to be concluded with a technical analysis of WTI’s four hour chart.
Oil: Overview Report
Easing of US oil market’s tightness
For starters we note that the number of active oil rigs in the US continued to drop, reaching 501, according to Baker Hughes, in another sign of a lack of demand in the US market. It would seem that such a tendency was verified by the release of the API weekly crude oil inventories figure last Tuesday, as an increase of US oil inventories was reported, albeit somewhat narrow.
It should be noted that also EIA unexpectedly showed an increase of the US oil inventories by 2.9 million barrels, aligning with the above assumption. EIA also stated that US crude oil production levels rose to a record high of 13.3 million barrels per day (bpd), highlighting the increase of productivity in the US oil market. Overall it seems that US oil production levels were able to reach and surpass demand in the US and that may have weakened oil prices. Should US oil market data continue to show a slack in the US market we may see prices continuing to weaken.
The demand side
On a positive note about the demand side of the international oil market, China was reported increasing the imports of Russian oil for the past month, in a sign of potential increased demand from the manufacturing-centered economy. Yet on the other hand, China is also reported to expect a slowdown in the increase of domestic oil production, which may be forcing the Chinese economy to increase its imports.
Nevertheless, we tend to maintain our worries for the recovery of the Chinese economy, especially the manufacturing sector which is also the main consumer of oil in the Chinese economy and thus the demand outlook tends to remain uncertain for the time being.
Angola leaves OPEC
There has been a last minute development regarding OPEC and thus the supply side of the international market. Specifically, Angola is reported to have announced that it’s leaving the OPEC oil production organisation. Angola’s oil minister, Mr. Diamantino Azevedo, is reported to have stated that Angola is leaving OPEC as its membership does not serve Angola’s interests. To show the importance of Angola’s oil production levels, Reuters reports that Angola’s contribution to the oil producing cartel’s production was of 1.1 million barrels per day, while OPEC’s total was of 28 million barrels per day.
It should be noted that Angola has protested to the new, lowered, production levels set by OPEC for 2024. The disagreement was able to delay the announcement of OPEC’s scheduled production levels last month. A possible exit of Angola would have a double effect on the supply side of the international oil market, as it would on the one hand allow Angola to increase freely its production levels and at the same time chase for higher market share.
Yet the exit of Angola from OPEC, may also exercise pressure on other oil-producing countries which have joined the cartel and want to follow similar marketing strategies, focusing more on volume, rather than on price. The announcement underscored the notion that even should Saudi Arabia try to cut production levels even lower, some other oil producer may come in to fill in the gap, at least partially. For the time being Saudi Arabia seems to be in a defending position, trying to tame any possible centrifuge forces within the oil-producing cartel. Should more African oil-producing nations follow Angola’s example or even imply such tendencies, we may see the bearish sentiment for prices intensifying, as it would imply a wider supply of oil for the international markets.
Oil: Technical Analysis
WTI Cash 4 Hour Chart
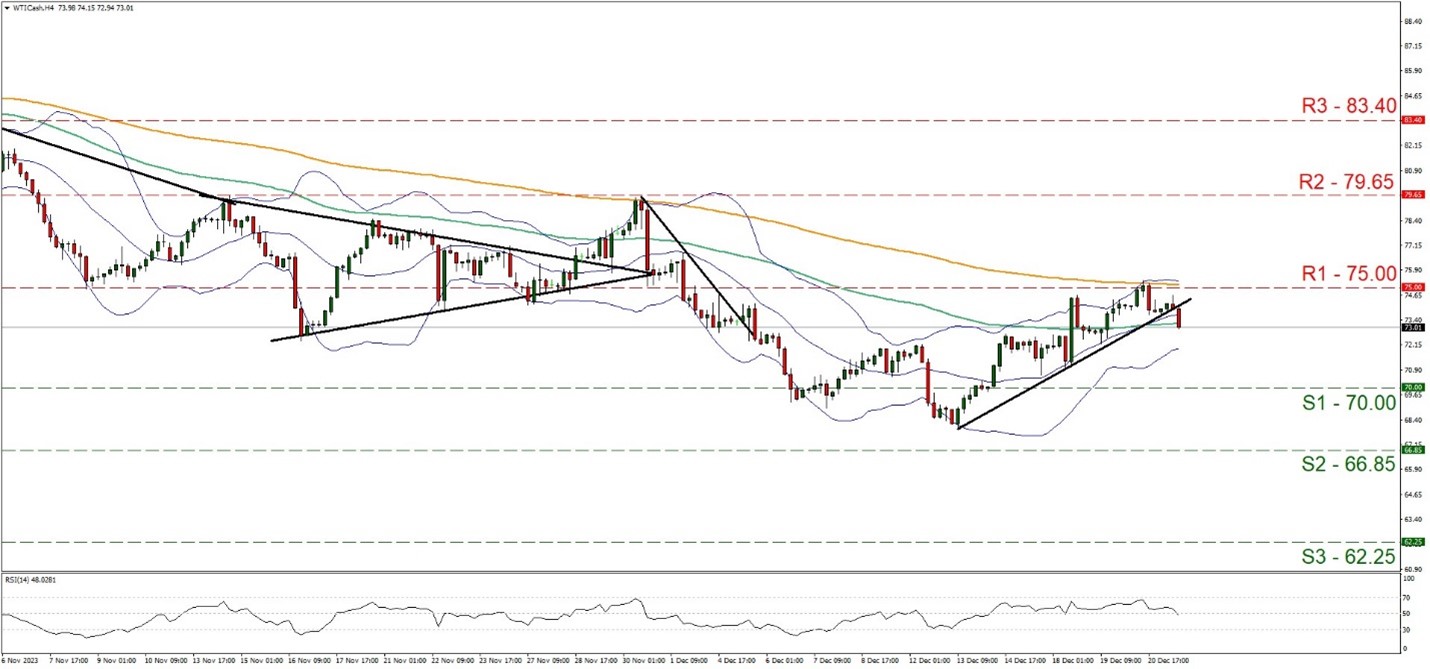
- Support: 70.00 (S1), 66.85 (S2), 62.25 (S3)
- Resistance: 75.00 (R1), 79.65 (R2), 83.40 (R3)
WTI’s price action corrected lower after hitting a ceiling on the 75.00 (R1) resistance line. Given that the commodity’s price action has broken the upward trendline guiding it since the 13th of December, signaling an interruption of the upward movement we tend to switch our bullish outlook in favor of a sideways motion initially. Furthermore, we note that the RSI indicator has dropped below the reading of 50 implying that the bullish sentiment of the market has faded away at the present stage.
Should the bears take the initiative and control over the commodity’s price action, we may see WTI’s price breaking the 70.00 (S1) support line and aim for the 66.85 (S2) support level. Should the buying interest be renewed, we may see the commodity’s price reversing direction, breaking the 75.00 (R1) resistance line and aiming for the 79.65 (R2) resistance nest.
سلب مسئولیت:
This information is not considered investment advice or an investment recommendation, but instead a marketing communication. IronFX is not responsible for any data or information provided by third parties referenced or hyperlinked, in this communication.


