
WTI traders may have noticed the marked fall , since our last report, of the commodity’s price. In the current report we intend to have a look at the state of the US oil market, yet also on an international level, discuss factors on the demand and supply sides that drive oil prices. To conclude the report we will also provide a technical analysis of WTI’s daily chart.
Oil: Overview Report
Slack in the US oil market maintained
The state of the US oil market seems to have been maintained. Characteristically the number of active oil rigs in the US dropped by two, according to Baker Hughes from 508 to 506. The drop of active oil prices seemed to imply an easing of the demand side in the US oil market and thus may have a bearish effect on oil prices should it intensify.
Furthermore, we note that US oil reserves have increased for the second week in a row according by API. The increase reported was not immaterial, as reached more than 4 million barrels. Also, EIA reported an increase of US oil reserves, yet EIA’s increase was narrower, of 2.7 million barrels.
Overall the data mentioned, tend to highlight that oil production levels, have surpassed aggregated demand for the commodity, which could be viewed as bearish for oil prices. Should we see the data regarding the US oil market show a continuance of the slack, we may see them having a bearish effect on oil prices.
Worries for tensions in the Middle East tend to ease
In our last report, we had highlighted a possible Iranian attack of Israel as possible factor that could create support for OiI. It should be noted that market worries for the tensions in the Middle East seem to have eased, since the counterattack of Iran to Israel. The attack may have been less impactfull than expected by the markets explaining thus the slipping of oil prices on Monday.
Please bear in mind that Iran’s attak was massive, yet Iran had warned in advance for the timing of the attack and Israeli forces along with airforce elements from other countries (such as the UK and the US), were able to defend rather successfully Israel. Iran also mentioned that the attack is a once-off unless Israel retaliates, in which case Iran may have to respond “within seconds”.
Yet the Israeli government under Benjamin Netanyahou, seems to contemplate how to respond. It should be noted that US media highlighted the possibility of any Israeli attack on Iran to be delayed until the end of April beginning of May, given the Jewish holiday of Passover.
That may also allow market worries to ease somewhat, yet at the same time tensions are expected to keep simmering under the surface, which may lead to continuous sensitivity of oil prices and possibly unexpected spikes for oil prices, from time to time.
Developments around OPEC and Chinese demand
On the production side of the international oil market, we note OPEC’s intentions to keep production levels low. OPEC’s intentions are expected to keep the production side tight and thus could provide support for oil prices. Furthermore, the organisation seems to expect supply, from oil-producing economies that are not OPEC members, to drop, making the supply side of oil even tighter.
The situation intensifies further as OPEC expects oil demand to be robust over the summer, a scenario that may provide an additional push higher for oil prices. Characteristically the Organization of the Petroleum Exporting Countries, in a monthly report, said world oil demand will rise by 2.25 million barrels per day (bpd) in 2024 and by 1.85 million bpd in 2025.
All of the above could have a bullish effect on oil prices. Please note that the oil production organisation seems to be aiming for a possible inclusion of Namibia, which in turn could widen somewhat OPEC’s grip on the international oil market.
Across the world, we note that China’s economic recovery seems to be slowly showing some encouraging signals, implying a possible improvement of oil demand in the Chinese economy. We note that China’s GDP rate for Q1 unexpectedly accelerated which could be interpreted as a signal for higher oil demand and similarly the industrial output growth rate for March despite slowing down, the deceleration proved to be narrower than expected.
Overall should signs for a possible improvement of the Chinese economic outlook continue to emerge, they may have a positive effect on oil prices.
Oil: Technical Analysis
WTI Daily Chart
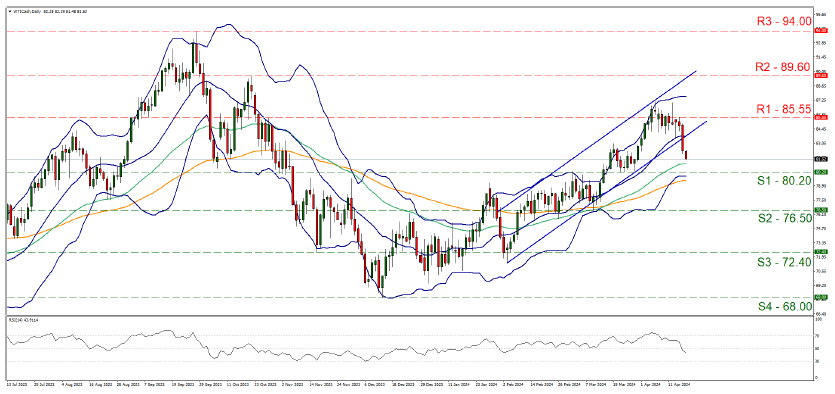
- Support: 80.20 (S1), 76.50 (S2), 72.40 (S3)
- Resistance: 85.55 (R1), 89.60 (R2), 94.00 (R3)
Oil ‘s price fell yesterday, aiming for the 80.20 (S1) support line. It should be noted that the price action in its fall broke the lower boundary of the upward channel that was supporting the price actions’ bullish movement since the 5th of February. The slight bearish tendencies during today’s Asian session, tended to underscore the interruption of the upward movement.
Similarly the RSI indicator below our daily chart dropped breaking below the reading of 50 and implying that the bullish sentiment in the market is fading away. Hence we switch for the time being our bullish outlook, in favour of a sideways movement with the possibility of it turning bearish.
Yet for a clearcut bearish outlook, we would require the commodity’s price action to substantially break the 80.20 (S1) support line, which tended to provide support for WTI’s price action around the 21st to 27th of March and served as a platform for the price action to move higher. Lower than that we also note the 76.50 (S2) support level, as the next possible target for the bears.
Should the commodity’s price confine itself in a sideways motion, we may see the 80.20 (S1) support line serving as the lower boundary of the sideways motion, while the 85.55 (R1) resistance line as the upper one.
Should the bulls regain control over WTIs’ price action, we may see it breaking the 85.55 (R1) resistance line and taking aim of the 89.60 (R2) resistance level, a level that reversed WTI’s upward movement on the 20th of October last year.
سلب مسئولیت:
This information is not considered investment advice or an investment recommendation, but instead a marketing communication. IronFX is not responsible for any data or information provided by third parties referenced or hyperlinked, in this communication.


