
Market sentiment about oil prices seems to be in limbo, and the commodity’s price seems to be hesitating about the direction of its next leg. In this report, we aim to shed light on the factors driving WTI’s price over the past week, assess its future outlook, and conclude with a technical analysis of WTI.
Oil: Overview Report
The situation on the ground of the US oil market
There was a question set last week with API’s huge increase of US oil inventories which was not verified by EIA, as its report was delayed, as to how wide the slack in the US oil market actually was. Making a start with the Baker Hughes oil rig count which showed another contraction of the number of active oil rigs in the US by two. The report implied further easing of demand or even better efficiency of active oil rigs.
During the week we note that API reported another increase of US oil inventories albeit not as wide as the one last week’s, with the increase reported being of only 1.335 million barrels. The next day EIA reported also a rise of US oil inventories by 3.6 million barrels. In both cases we note that the releases showed that demand was not able to reach production levels, implying that a slack still existed in the US oil market. Overall should the US oil inventories continue to increase we may see the situation exercising a bearish effect on oil prices in the coming week as well.
Demand worries from China
The market worries for the demand side of the international oil market tended to persist, especially about China, fuelling bearish tendencies of oil prices further. The fact that despite some improvement the Chinese manufacturing sector continues to struggle, the fresh signs faced by China’s construction sector and the easing of throughput of Chinese refineries, tended to renew the worries for Chinese oil demand. Specifically, the drop in residential property prices in China is highlighting the problems faced by the Chinese construction sector with the market worries focusing on that should economic activity in the Chinese construction sector contract even further it may have an adverse effect on the demand side of the oil market.
At this point though we would note that there are also some signs of a recovery of the Chinese economy that is encouraging also for oil buyers. Should expectations for a possible slowdown or even a contraction of economic activity in China intensify, we may see the bearish effect on oil prices growing and vice versa.
OPEC’s and EIA’s bullish expectations
Yet it’s not all dark and gloomy in the international oil market. It’s characteristic that the International Energy Agency (IEA) and the producer group OPEC tend to remain bullish in their outlook for the oil market. The IEA in its report, raised its expectations for oil demand to grow in 2023 by another 100 thousand barrels per day (bpd). Similarly, OPEC also raised its expectations for oil demand in 2023. It should be noted that both organisations have placed a substantial role in China. IEA in their demand outlook is expecting China to lift its demand by 1.8 million bpd in 2023.
Yet for such forecasts to be materialized, China will have either to experience a substantial increase in economic activity and thus consume the extra oil or raise its oil inventories. We tend to remain skeptical of such an increase in demand from China. Nevertheless, we note that should there be signs to that end we may see prices getting some support. On the supply side, we have to note that there seems to be no indication of production cuts, which could tighten the international oil prices and provide some additional bullish tendencies for oil’s prices.
Oil: Technical Analysis
نمودار چهار ساعته WTI
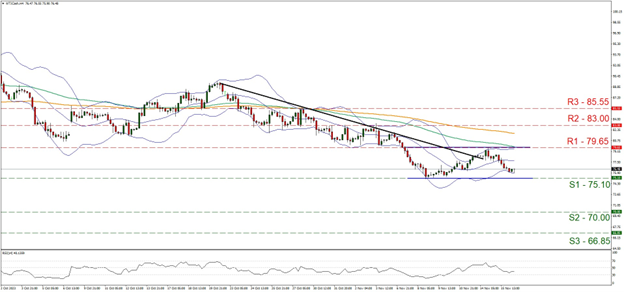
- Support: 75.10 (S1), 70.00 (S2), 66.85 (S3)
- Resistance: 79.65 (R1), 83.00 (R2), 85.55 (R3)
WTI (oil) continued to weaken aiming for the 75.10 (S1) support line. It should be noted that the current stabilisation of the commodity’s price, comes after a marked drop.
For the time being, we tend to maintain our bias for a sideways motion in the channel formed by the 79.65 (R1) resistance line and the 75.10 (S1) support level, yet we also note the bearish tendencies of the commodity’s price action. It’s characteristic that the RSI indicator retreated below the reading of 50 and is nearing the reading of 30, implying a build-up of the bearish sentiment in the market.
Yet for a bearish outlook, we would require the commodity’s price to break the 75.10 (S1) support line and aim for the reading of 70.00 (S2) support barrier. Even lower we note 66.85 (S3) support level as a possible target for the bears. Should the bulls take over, we may see WTI’s price breaking the 79.65 (R1) resistance line and aim for the 83.00 (R2) resistance hurdle. In an extremely bullish scenario we may see WTI’s price breaking the 85.55 (R3) resistance level.
سلب مسئولیت:
This information is not considered investment advice or an investment recommendation, but instead a marketing communication. IronFX is not responsible for any data or information provided by third parties referenced or hyperlinked, in this communication.


