
Gold’s price seems to be supported since our last report. The market’s expectations for the Fed’s intentions, recent financial data releases and tensions in the international scene seem to have influenced the path of Gold’s price in the past few days. Today we are to discuss the fundamental challenges laid ahead for the precious metal, while we will be concluding this report with a technical analysis of gold’s daily chart.
The Fed’s intentions
Gold market participants continue to keep a close eye on the Fed’s intentions. It should be noted that the market’s expectations about the bank continue to shift, aligning with the Fed’s narrative of fewer rate cuts and currently Fed Fund Futures imply that the market expects the bank to cut rates three times next year, starting from June onwards. On a fundamental level, we note the release of the Fed’s January meeting minutes.
The bank in its minutes displayed a hesitation to proceed with rate cuts, contradicting the market sentiment and temporarily halting gold’s rise on Wednesday. It’s characteristic that Fed Board Governor Waller at the end of last week noticed that he would require more evidence that inflation is easing before cutting interest rates. Such comments tend to highlight the hawkish predisposition of the Fed and may weigh on gold’s price.
USD’s path, US yields and gold
We note that the greenback’s bearish tendencies over the past few days may have allowed for gold’s price to ascend higher on a fundamental level as well given the perceived negative correlation of the two trading instruments.
Should the bearish tendency of the USD be maintained we may see gold’s price rising further. Similarly, the relative stabilisation of US yields over the past week may also have allowed gold’s price to rise, as the market’s attention may have shifted from US bonds polishing the shiny metal’s appeal further. We expect that should US yields start falling, we may see gold’s price gaining and vice versa.
Highlights coming up
In the coming week, we note that there are a number of financial data releases stemming from the US, yet we tend to focus on two. First would be the release of the revised US GDP rate for Q4 on Wednesday. A possible upward revision of the US GDP rate for the last quarter of 2023, could enhance the narrative of the Fed for a possible soft landing of the US economy and may weigh on gold’s price.
Furthermore we also note the release of the Fed’s favorite inflation measure, namely the Core PCE price index for January on Thursday. Should the rates slow down less than expected as did the headline CPI rate for the same month, or even should the rates fail to slow down we may see the release weakening gold’s price as the release may add pressure on the Fed to keep rates high for longer.
Gold: Technical Analysis
XAUUSD Daily Chart
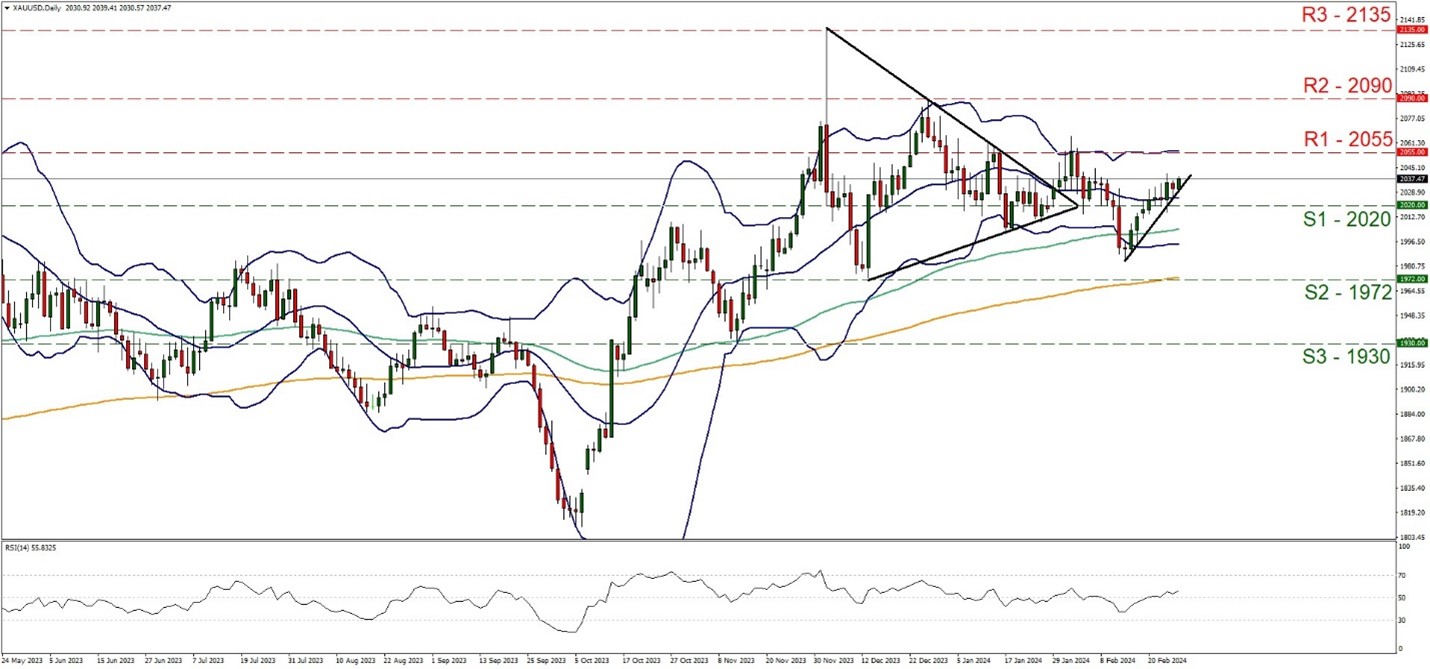
- Support: 2020 (S1), 1972 (S2), 1930 (S3)
- Resistance: 2055 (R1), 2090 (R2), 2135 (R3)
On a technical level, we note that gold’s price was able to rise despite a correction lower yesterday Monday. Overall we tend to maintain a bullish outlook for the precious metal’s price action as long as the upward trendline guiding it since the 14 of February remains intact.
Furthermore, we also note that the RSI indicator has risen above the reading of 50 with an upward slope also implying that any bearishness in the market sentiment has faded away and a bullish sentiment seems to be building up for gold’s price. Yet on the other hand there seems to be some fatigue among gold bulls as the bullion’s price seems to find some difficulty in forming higher highs. Should the bulls actually maintain control over gold’s direction, we set the next target for buyers of gold, at the 2055 (R1) resistance line, while even higher, we note the 2090 (R2) resistance hurdle.
For an extremely bullish scenario, we note the 2135 (R3) resistance barrier, which is also an all-time high for the bullion’s price. For a bearish outlook, we would require gold’s price, initially to break the prementioned upward trendline clearly, signaling the end of the upward movement and to continue to break the 2020 (S1) support line which may imply an initiation of a bearish movement and continue lower taking aim of the 1972 (S2) support base. Even lower we note the 1930 (S3) support level which reversed the precious metal’s downward movement in November.
سلب مسئولیت:
This information is not considered investment advice or an investment recommendation, but instead a marketing communication. IronFX is not responsible for any data or information provided by third parties referenced or hyperlinked, in this communication.


