
Gold’s price has tended to remain in a relative sideways motion since our last gold report. It seems as if the market remains uncertain and is currently looking for a new direction. Today we are to discuss the fundamental challenges laid ahead for the precious metal, while we will be concluding this report with a technical analysis of gold’s daily chart.
Gold’s negative correlation with the USD
It should be noted that the negative correlation of the USD with gold’s price seems to have been interrupted since our last report. The release of the US December CPI rates tended to highlight the persistence of inflationary pressures in the US economy. It should be noted that the headline CPI rate accelerated beyond market expectations and reached 3.4% year over year, while on a core level, it slowed down less than expected. The hotter-than-expected inflation report, in conjunction with the tighter-than-expected employment market for the same month, may allow Fed policymakers to maintain the bank’s narrative of high rates for a longer period, contradicting the market’s expectations for an extensive rate-cutting monetary policy in the current year.
Yet the market seems to remain unconvinced and sticks to its dovish expectations. It was characteristic how the USD and gold wobbled for a while after the release yet returned practically to the positions they had before. Nevertheless, we expect Fed policymakers to repeat their warning that any rate cuts may be delayed, which could provide some support for the USD and weigh on gold’s price. We note that there are a number of Fed policymakers scheduled to speak in the current week, and given that the market has largely priced in extensive rate cuts for the current year, we would not be surprised to see them pushing back against such expectations.
A rise in US yields could weigh on gold’s price
It should be noted that US yields have tended to fall since our last report, yet since yesterday they have recovered considerable ground. It’s characteristic that the 10-year, 5-year, and 3-year bond yields are at higher levels than last Tuesday, with one exception being the 2-year bond yield. Given that US bonds are an alternative for gold traders, a possible rise in US yields could weaken gold’s price, as the attractiveness of US bonds may intensify, given that gold bears no interest.
The Red Sea situation stokes uncertainty
The US and UK air strikes against Houthi positions last week seem to have escalated the tensions in the Middle East. It should be noted that Houthi rebels have vowed for reprisals for US and UK attacks, and it is characteristic that they have launched missiles against US, UK, military, and merchant vessels. For the time being, there seems to be no diplomatic solution in sight, and despite the US and the UK having military superiority, Houthi rebels do not seem willing to back down. The escalating tensions tend to scare off ships from navigating through the Red Sea and are currently forcing vessels to circumvent Africa.
Understandably, shipping costs may rise, and in such a case, the increased costs may be rolled over to consumers, which in turn may spark a new wave of inflation. For the time being, the scenario remains somewhat remote, yet it should be kept under a watchful eye, as a failure of inflationary pressures to ease further could prompt central banks to maintain rates at higher levels or cut rates at a slower pace, which in turn may weigh on gold’s price in the longer run.
Gold: Technical Analysis
XAUUSD Daily Chart
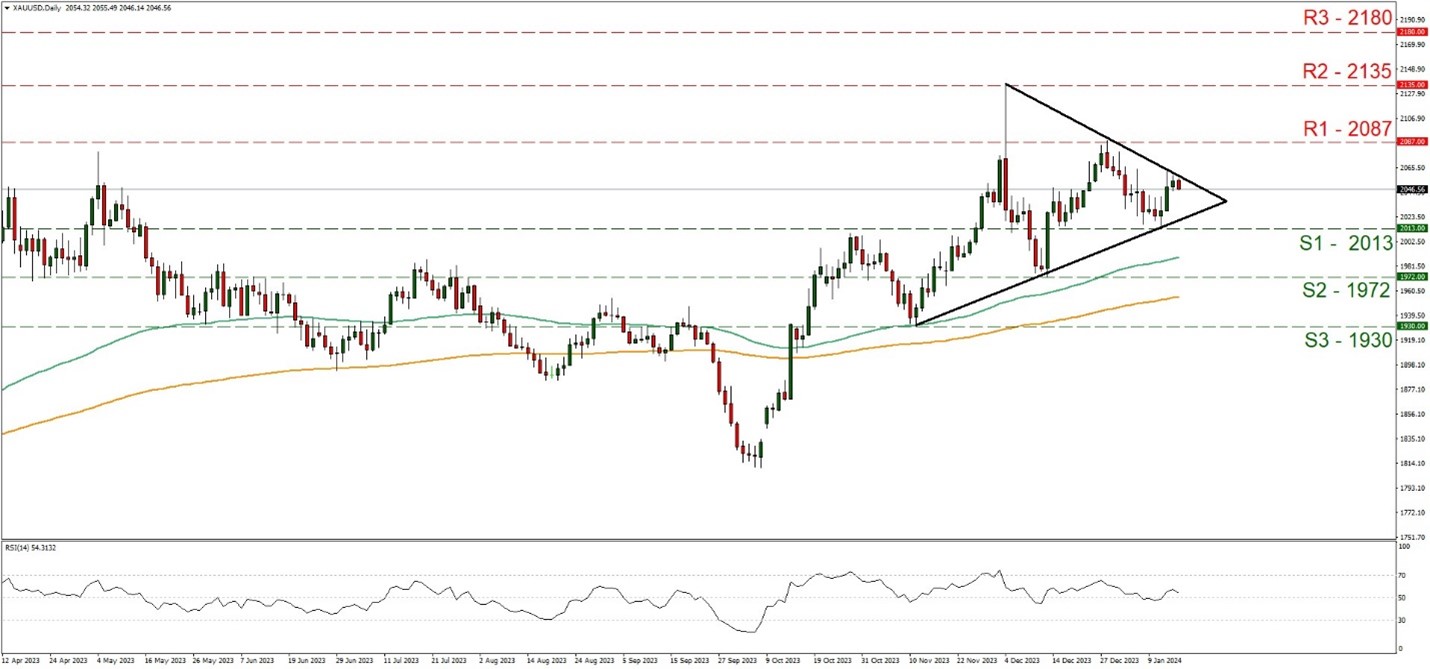
- Support: 2013 (S1), 1972 (S2), 1930 (S3)
- Resistance: 2087 (R1), 2135 (R2), 2180 (R3)
On a technical level we note that gold’s price seems to maintain a sideways motion between the 2013 (S1) support line and the 2087 (R1) resistance line. We tend to maintain a bias for a sideways motion to continue, given the price action of the past few days, and note that gold’s price action seems to be entering a symmetrical triangle, which allows for the direction of the next leg of the precious metal’s price action to be either way.
The RSI indicator below our daily chart seems to fail to distance itself from the reading of 50 which could allow for some ambiguity regarding the market’s intentions. For a bullish outlook, we would like to see a clear break above the 2087 (R1) resistance level, with the next potential target for the bulls being the 2137 (R2) resistance ceiling. Whereas, for a sideways bias to occur, we would like to see the precious metal remain confined between the 2013 (S1) support level and the 2087 (R1) resistance level.
Lastly, for a bearish outlook, we would like to see a clear break below the 2013 (S1) support level, with the next possible target for the bears being the 1972 (S2) support base.
سلب مسئولیت:
This information is not considered investment advice or an investment recommendation, but instead a marketing communication. IronFX is not responsible for any data or information provided by third parties referenced or hyperlinked, in this communication.


