
Since our last report, gold’s upward direction was maintained last week breaking to new record high levels by surpassing $2900/ounce in today’s Asian session. In today’s report, we are to discuss the possible implications of the release of the US CPI rates for January and Fed Chairman Powell’s testimony, the fundamental issues created for gold traders by Trump’s new tariffs and its relationship with the USD. For a rounder view, we will conclude the report with a technical analysis of gold’s daily chart.
USD’s negative correlation with gold’s price remains inactive
The movement of the USD index over the past five days remained in upward fashion, something that was also the case for gold’s price, albeit gold continues to maintain clearer bullish tendencies than the USD for which bulls show some indecisiveness.
Overall we continue to see the case for the negative correlation of the USD with gold’s price to be inactive. Also US yields were on the rise since the 5 of February, yet seem to have failed to divert investments from gold, towards US bonds. Hence the above ascertainment forces to look for the fundamental reasons behind the ascent of gold’s price elsewhere.
Trump’s new 25% tariffs support gold prices
Trump announced on Monday that he intends to impose 25% tariffs on all US steel and aluminium imports, “without exceptions and exemptions”, possibly by Wednesday. It should be noted that there are allready tariffs applied on US steel and aluminium imports of 10%, which are to be raised to 25%. The tariffs are expected to hit primarily US imports from Canada, Brazil, Mexico, South Korea which entered the US duty free until now.
One exception may be Australian exports of steel and aluminium as the land down under claims to have a trade deficit with the US, an element that US President Trump seems to be taking account of. In any case, Trump’s intentions to impose tariffs and his mercantile protectionist approach, combined by a wide degree of unpredictability and his flamboyant style, tends to enhance market uncertainty about the global economic outlook.
Thus gold tends to be concentrating safe haven inflows as market participants try to weather the storm. The above realisation tends to enhance the role of safe haven investment if compared to the other two pillars in gold demand, namely physical consumer demand (especially in China and India), central bank gold buying, without that implying that demand for such activities has eased.
January’s US CPI rates and Fed Chairman Powell’s testimony
We note the disassociation of the paths of the USD and gold as trading instruments, yet we note two events at which the negative corelation of the two trading instruments could be re-established even briefly. The first would be in today’s late American session, as Fed Chairman Powell delivers his first testimony before the US Congress.
Should the Fed Chairman maintain a less dovish tone that what the market may be expecting, we may see the speech weighing on gold’s price as the market may have to readjust its current expectations for the bank to deliver a rate cut in the June meeting. We also note the release of the US CPI rates for January on Wednesday’s early American session, as another event that could affect gold’s price. Should the release show an easing of inflationary pressures in the US economy, we may see gold’s price getting some support.
Gold Technical Analysis
XAUUSD 4H Chart
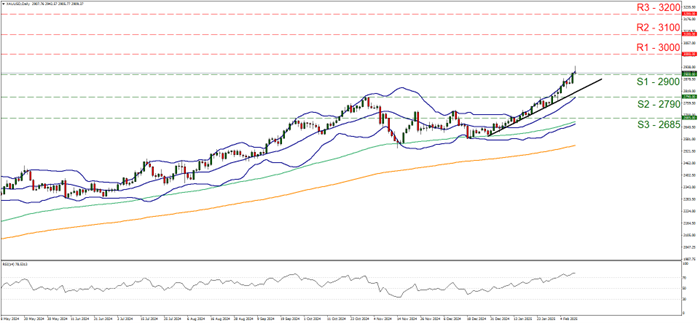
- Support: 2900 (S1), 2790 (S2), 2685 (S3)
- Resistance: 3000 (R1), 3100 (R2), 3200 (R3)
Gold’s price continued its upward movement in the past week and the precious metal’s price reached new record high levels by breaking the 2900 (S1) resistance line, now turned to support. On a technical level, we maintain our bullish outlook of the precious metal as long as the upward trendline initiated at the end 24 remain intact and we note the upward deviation and steepening of the slope of the rising price action.
Also we note that the RSI indicator remains above the reading of 70, implying a strong bullish sentiment among market participants, yet at the same time may also imply that the precious metal’s price has reached overbought levels and is ripe for a correction lower. Similar signals come out of the fact that gold’s price is constantly flirting with the upper Bollinger band.
Should the bulls maintain control as expected, we may see gold’s price aiming for the 3000 (R1) resistance line, with the next target for the bulls being set at the 3100 (R2) resistance level. A bearish outlook currently seems remote and for it to be adopted we would require gold’s price to fall, breaking the 2900 (S1) support line continue to break the prementioned downward trendline in a first signal that the upward motion has been interrupted and continue lower to aim if not break the 2790 (S2) support level, with the next possible target for the bears being the 2685 (S3) support level.
سلب مسئولیت:
This information is not considered investment advice or an investment recommendation, but instead a marketing communication. IronFX is not responsible for any data or information provided by third parties referenced or hyperlinked in this communication.


