
During the previous week the Gold market performed its most quiet session for a considerable time looking back, not allowing for any fireworks to prevail. Despite the price action being rather muted, a number of important fundamental and economic developments have emerged recently possibly adding some spice to the scene. Through this report we aim to create awareness among Gold traders overviewing subjects and events that could create movements in the next days. As a closure, our Gold technical analysis will bring forth support and resistance levels that stand out from our perspective.
In the past days a number of well-known media sources such as Euronews, CNN and Reuters referred to the G7 meeting that took place in Germany. The 7 largest economies of the world are preparing for another measure against Russia which is instigating a war in Ukraine since February. The G7 group is now aiming at the Russian Gold market which could be generating revenues that end up funding the ongoing war in Ukraine. According to Reuters, Russia is one of the world’s largest producers of gold, along with China and Australia. Yet Russia’s exports to Europe have slowly been reduced since the war started with various countries cutting imports almost instantly. For now, analysts see Russian Gold exports heading mostly to Asian countries which is a rather similar case to what is happening with Russian Oil exports. Moreover, with G7’s organized action aiming at banning Russian Gold, we may see more countries turning down Gold imports from Russia. This could potentially create a change in the supply and demand strings of the physical Gold market which may lead to increased volatility for Bullion. Russia’s contribution to the International gold market is about to be tested.
A remarkable day from the past week, which in our view is worth mentioning was the 23 of June. On that day the market anticipated two significant market moving events that we included in our previous report. First the Preliminary US PMI data for June which ended up being very pessimistic as figures dropped notably highlighting worries of an economic slowdown and second Fed Chairman Jerome Powell’s speech before Congress. The catch here is that despite the negative PMI data, the USD Index ended the day higher while Gold prices were on the decline. In our view, Gold could have been used as a hedge for economic uncertainty but instead traders sold positions as Jerome Powell’s comments may have been more hawkish including statements like “The American economy is very strong and well positioned to handle tighter monetary policy”. The hawkish remarks may have provided support for the greenback, which tends to counter Gold, with the two instruments having a negative correlation. This may also be evidence that traders may be gravitating towards what the Fed is willing to do looking forward, compared to what the PMI data is saying for the recent months.
In terms of financial releases coming up in the next days, we note a few that could act as motivation for Gold traders and create volatility for Bullion. On the 29 of June Fed Chairman Jerome Powell, ECB President Christine Lagarde, BOE Governor Andrew Bailey speak at the ECB Forum on Central Banking. On the 30 of June we get the US Consumption Adjusted and Core PCE Price Index rates for May along with the weekly initial jobless claims figure. We highlight the PCE Index rate as it remains among the metrics observed by the FED, possibly becoming more interesting to traders. On the 1 of July we get the Final Manufacturing PMI figure as well as the ISM Manufacturing PMI both for June.
تجزیه و تحلیل فنی
XAUUSD Daily
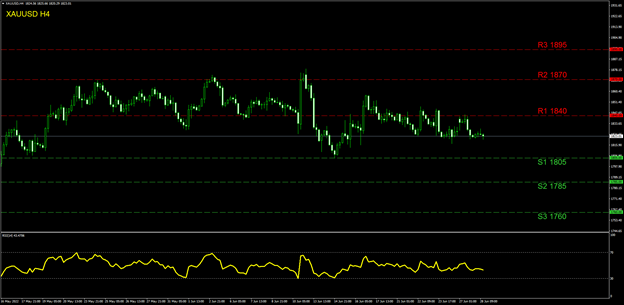
Gold is currently trading between the (R1) 1840 resistance and the (S1) 1805 support levels which makes them both the most probable targets in a buying or selling strategy accordingly. Yet since the 9 of May Gold’s price action has moved in a broader sideways motion between the (R2) 1870 resistance and the (S1) 1805 support making these levels the highest and the lowest Gold has tested since the noted period. Outside this range we also note the (S2) 1785 barrier which could be engaged in an extensive bearish trend and could form a new 2022 low for the precious metal. Overall, we tend to maintain our sideways bias for Gold’s current trend as our personal view, while the RSI indicator below our chart seems to be cruising across the 44 level implying some selling may be in play for now.
اگر در مورد این مقاله سوال یا نظر ی کلی دارید، لطفاً ایمیل خود را مستقیماً به تیم تحقیقاتی ما بفرستیدresearch_team@ironfx.com
سلب مسئولیت:
This information is not considered investment advice or an investment recommendation, but instead a marketing communication. IronFX is not responsible for any data or information provided by third parties referenced or hyperlinked, in this communication.


