Since our last report, the rally of gold’s price appears to have eased with the precious metal’s price pulling back from it’s all time high figure. In today’s report we discuss the apparent willingness by the US and China to work on a possible trade deal and we also discuss upcoming US financial releases. We are to conclude the report with a technical analysis of gold’s daily chart, for a rounder view.
US-China trade relationship on the mend?
Since our last report, the trade war narrative appears to be easing, with the US seemingly willing to proceed to the negotiation table in an attempt to find an amicable trade solution with China.
In particular, the US’s tone on China appears to be softening with US Treasury Secretary Scot Bessent stating last Wednesday that “Neither side believes that these are sustainable levels.
As I said yesterday, this is the equivalent of an embargo and a break between the two countries in trade does not suit anyone’s interest”. The comments by the Treasury Secretary showcase a softer tone on China when compared to the tit-for-tat retaliatory tariffs that were being imposed on each other almost on a daily basis.
Moreover, President Trump per Reuters implied that he was in contact with Chinese President Xi Jinping, which may imply that the two nations may have been working together towards an amicable trade deal.
However, from the Chinese Government’s side that does not appear to be the case with the Chinese Embassy in the US stating that “there have been no consultations or negotiations between China and the US on the issue of tariffs, let alone any agreement being reached”.
Although it should also be said that China has excluded some US imports from its 125% tariffs, as reported by Reuters, which on their part may signal a willingness to cooperate with the US. Nonetheless, the easing of tensions may have weighed on gold’s price and thus should trade agreements be struck, resulting in the reduction or elimination of tariffs, it may weigh on gold’s price.
However, should the apparent progress be reversed, it may instead aid the precious metal’s price.
Upcoming US Financial releases
There are two financial releases we would like to keep an eye out for this week. The first being the Core PCErates for March that are due out for Wednesday, that are expected to come in at 2.6%, which would be lower than the prior rate of 2.8% and thus would imply easing inflationary pressures in the US economy.
In such a scenario, an easing of inflationary pressures in the US economy may weigh on gold’s price as it is considered to be a hedge against inflation. Secondly, the release of the US Employment data for April on Friday where the NFP figure is expected to come in at 130k, which would be lower than the prior figure of 228k and may thus imply a loosening labour market.
However, it should be noted that the unemployment rate is expected to remain steady at 4.2% and the Average earnings on a year-on-year basis is expected to increase from 3.8% to 3.9%.
Thus, should the NFP figure come in as expected or lower it may weigh on the dollar whilst aiding gold’s price given their inverse relationship, although the impact may be mitigated by the average hourly earnings rate which could provide some support for the greenback.
Gold Technical Analysis
XAUUSD 4H Chart
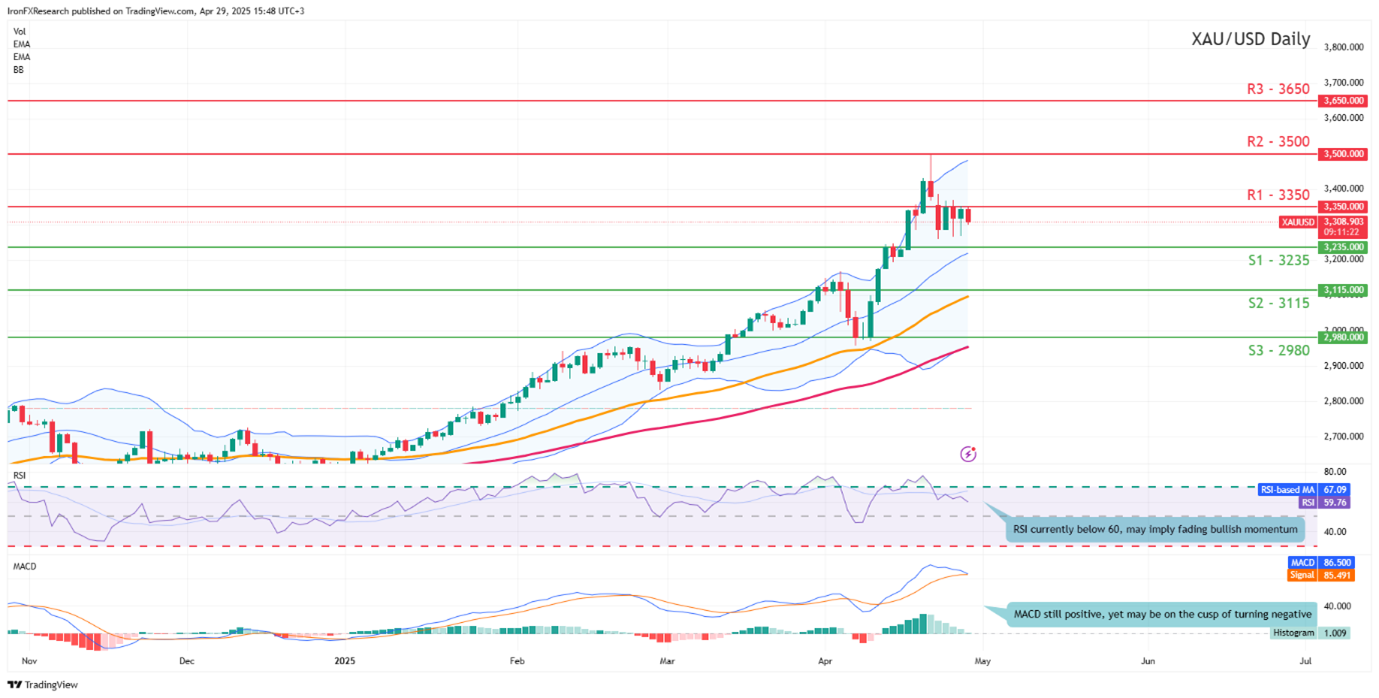
- Support: 3235 (S1), 3115 (S2), 2980 (S3)
- Resistance: 3350 (R1), 3500 (R2), 3650 (R3)
On a technical level, we highlight the continued failure by the bulls to clear our 3350 (R1) resistance line over the past few days. Generally speaking, Gold’s price appears to be moving in a predominantly upwards trajectory.
Yet for our weekly report we would opt for a sideways bias for the precious metal’s price and supporting our case is the RSI indicator below our chart which has currently dropped below the figure of 60, implying that the bullish momentum may be easing.
For our sideways bias to be maintained, we would require the precious metal’s price to remain confined between the 3235 (S1) support level and the 3350 (R1) resistance line. On the flip side for a bullish outlook, we would require a clear break above the 3350 (R1) resistance line with the next possible target for the bulls being the 3500 (R2) resistance level.
Lastly, for a bearish outlook, we would require a clear break below our 3235 (S1) support level with the next possible target for the bears being the 3115 (S2) support line.
سلب مسئولیت:
This information is not considered investment advice or an investment recommendation, but instead a marketing communication. IronFX is not responsible for any data or information provided by third parties referenced or hyperlinked in this communication.


