
We note that all three major indexes corrected lower after hitting new record high levels since our report last week. In today’s report, we would like to address what fundamentally seems to be driving equities lower in the current week, the next big test for US stock markets, the troubles of Tesla and, for a rounder view, end the report with a technical analysis of S&P 500’s daily chart.
The Fed’s intentions
Since the start of the week US stock market bulls seem to be hesitant. The release of better-than-expected financial data revolving around the US manufacturing sector tended to highlight the resilience of the US economy. Characteristically we note that the ISM manufacturing PMI figure for March rose beyond expectations breaking the barrier of 50 for the first time since October last year, highlighting the expansion of economic activity in the sector. At the same time, we note that the factory orders growth rate for February accelerated beyond market expectations and thus aligned with March’s ISM manufacturing PMI figure. Despite the releases improving the outlook of the US economy, they also underscore the risk of the Fed maintaining high rates for a longer period. Such suspicions were further enhanced by recent statements of Fed policymakers, including Fed Chairman Powell, which tended to push back against market expectations for rate cuts to start in June, or at least express some hesitation for such a scenario to materialise. Should we see more statements of Fed policymakers intensifying market expectations for fewer rate cuts, we may see a more cautious approach being adopted by the markets and thus weigh on US stock markets.
March’s US employment data ahead
Given the importance of the Fed’s stance as analyzed before, and its dual mandate to watch over inflation and promote maximum employment, we also note as the next big test for US stock markets the release of the US employment data for March. Forecasts are for the Non-Farm Payroll (NFP) figure to drop to 200k if compared to February’s 275k, the unemployment rate to remain unchanged at 3.9% and the average earnings growth rate to slow down to 4.1% yoy. Should the actual rates and figures meet their respective forecasts, we expect the drop of the NFP figure to disappoint traders somewhat. Yet on the other hand, the figure still remains at relatively healthy levels, and the unemployment rate tends to imply a relative tightness of the US employment market. We do not expect such readings to materially alter the Fed’s stance thus we may see US stock markets being set under pressure. That is unless the drop of the NFP figure is wider than expected and thus may enhance market expectations for the Fed to cut rates and provide support for US stock markets.
Tesla delivers fewer cars than expected
We note that Tesla’s share price fell on Tuesday as headlines flooded the net noting that the company delivered a lower number of vehicles in the first quarter of the year than what was expected. Specifically, the company was reported to have delivered almost 387k cars in Q1 24, fewer than market estimations of 449k. The decline also is the first drop in sales on a year-on-year level since 2020, the start of the pandemic. One of the reasons cited for the drop is a slowing demand for Tesla’s cars in China, where the company is facing harsh competition from local EV makers. Another reason cited is the factory shutdown in Germany, Tesla’s only European plant. The company has been facing labour disputes, while also an arson by activists forced the company to shut down temporarily. The third reason mentioned which may be larger than Tesla as such and seems to be more systemic for the EV sector as a whole, is the recent preference of consumers for hybrid cars. Overall, we expect that should negative headlines continue to reel in, we may see the company’s share price retreating further.
تجزیه و تحلیل فنی
#US500 Cash Daily Chart
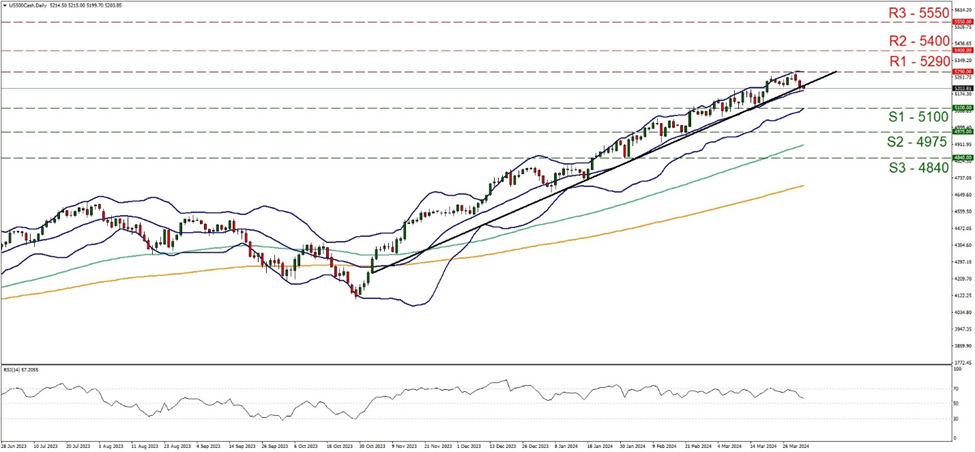
Support: 5100 (S1), 4975 (S2), 4840 (S3)
Resistance: 5290 (R1), 5400 (R2), 5550 (R3)
We note that on a technical level, S&P 500 has reached a new record high at the 5290 (R1) resistance level, before correcting lower. For the time being, we note that the upward movement that has been characterising the index since the end of October last year, seems to be set under doubt. The index’s price action is putting the upward trendline supporting it to the test today, while at the same time, we note that the RSI indicator is aiming for the reading of 50, which could imply that the market’s bullish sentiment may be easing. On the other hand, the 20, 50 and 100 moving averages are all still pointing upwards, implying a possible continuance of the bullish sentiment. Should the bulls maintain control over the index, we may see its price action breaking the 5290 (R1) resistance line and we set the next possible target for the bulls at the 5400 (R2) resistance level. To abandon our bullish outlook in favor of a sideways motion, we would require the index to clearly break the prementioned upward trendline, thus highlighting the interruption of the upward movement, yet respect the 5100 (S1) support line and the 5290 (R1) resistance level, thus creating a corridor confining its price action. For a bearish outlook, we would require the index’s price action not only to break clearly the prementioned upward trendline, but also to dive below the 5100 (S1) support line thus paving the way for the 4975 (S2) support base.
اگر در مورد این مقاله سوال یا نظر ی کلی دارید، لطفاً ایمیل خود را مستقیماً به تیم تحقیقاتی ما بفرستیدresearch_team@ironfx.com
سلب مسئولیت:
این اطلاعات به عنوان مشاوره سرمایه گذاری یا توصیه سرمایه گذاری در نظر گرفته نمی شود ، بلکه در عوض یک ارتباط بازاریابی است. IronFX هیچ گونه مسئولیتی در قبال داده ها یا اطلاعاتی که توسط اشخاص ثالث در این ارتباطات ارجاع و یا پیوند داده شده اند ندارد.


