The upward movement of US equities seems to be on the rise for a second week in a row. In today’s report we are to have another look at the upcoming US Employment data and the recent tariff rhetoric. Technically, we are to provide an analysis of S&P 500’s daily chart.
US Employment data on Friday
The US Employment data is set to be released on Friday. The employment data is expected to showcase a loosening labour market based on the current expectations by economists. In particular the NFP figure is expected to come in at 130k which would be lower than last month’s figure of 177k, with the average earnings rate also expected to come in at 3.7% which would also be lower than the prior month’s rate of 3.8%. Lastly, the unemployment rate is expected to remain steady at 4.2%. Overall, should the employment data come in as expected and showcase a loosening labour market it may increase pressure on the Fed to resume on it’s rate-cutting path, which could aid the US Equities markets. On the other hand, should the employment data showcase a resilient labour market it may provide leeway for the Fed should it wish to remain on hold in their next monetary policy meeting, which may weigh on the US Equities markets, as the financial conditions surrounding the US may remain restrictive.
Tariffs still on the menu
On Friday, the 30th of May, President Trump announced a 50% tariff on steel and aluminum imports. The updated tariff levies are set to go into effect today the 4th of June. The tariff announcement came hours after the US accused China of violating an agreement to mutually roll back tariffs and trade restrictions for critical materials. The situation highlights how delicate the trade negotiations still are and thus the announcement may have heightened worries about the state of the global economy, which in turn may have weighed on the US Equities markets. Yet should progress be made between the two countries in regards to trade talks moving forward, it may alleviate the aforementioned concerns and could thus aid the US Equities markets. Specifically, we are referring to the possible phone call between US President Trump and Chinese President Xi Jinping which may occur this week, per the White House press secretary. Overall, the situation may warrant close attention as it may lead to increased trading volatility.
تجزیه و تحلیل فنی
US500 Daily Chart
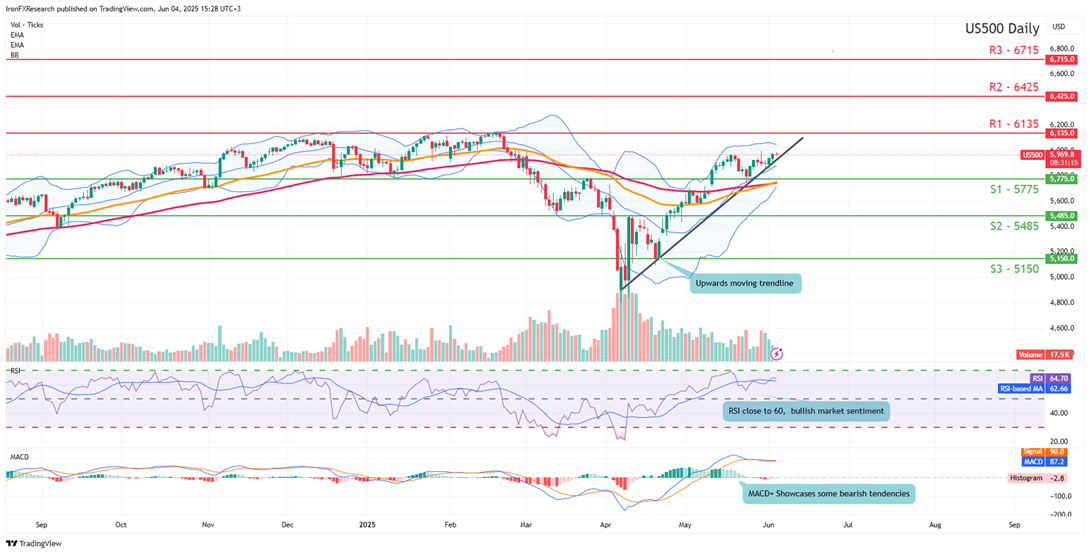
- Support: 5775 (S1), 5485 (S2), 5150 (S3)
- Resistance: 6135 (R1), 6425 (R2), 6715 (R3)
S&P 500 appears to be moving in an upwards fashion and is currently in the greens for a second week in a row. We opt for a bullish outlook for the index and supporting our case is the RSI indicator below our chart which currently registers a figure close to 60, implying a bullish market sentiment, in addition to the upwards moving trendline which was incepted on the 7th April. For our bullish outlook to continue we would require a clear break above the 6135 (R1) resistance line, with the next possible target for the bulls being the 6425 (R2) resistance level. On the other hand, for a sideways bias we would require the index to remain confined between the 5775 (S1) support level and the 6135 (R1) resistance line. Lastly for a bearish outlook we would require a clear break below the 5775 (S1) support level with the next possible target for the bears being the 5485 (S2) support line.
اگر در مورد این مقاله سوال یا نظر ی کلی دارید، لطفاً ایمیل خود را مستقیماً به تیم تحقیقاتی ما بفرستیدresearch_team@ironfx.com
سلب مسئولیت:
این اطلاعات به عنوان مشاوره سرمایه گذاری یا توصیه سرمایه گذاری در نظر گرفته نمی شود ، بلکه در عوض یک ارتباط بازاریابی است. IronFX هیچ گونه مسئولیتی در قبال داده ها یا اطلاعاتی که توسط اشخاص ثالث در این ارتباطات ارجاع و یا پیوند داده شده اند ندارد.


