
Nat.GASCash H4
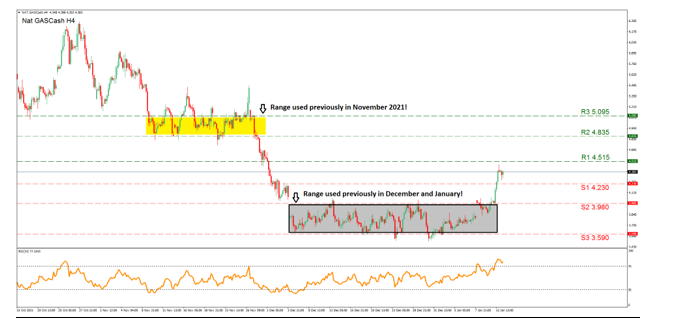
In the current week Natural Gas has made the largest move upwards compared to the other energy commodities, thus we have selected it for this report. With the very obvious upward movement observed on our the chart, we note first the RSI indicator that has climbed above the 70 level confirming the buying orders where in excess in the most recent sessions. We also observe the buying halted just below the (R1) 4.515 resistance level. Higher, we note the (R2) 4.835 resistance and even higher the (R3) 5.095 which can be used by traders supporting the buy side. The range between the (R2) and the (R3) is highlighted with yellow on our chart and it was used in November as the price action moved within it for the most part.
This range can become a target if the buying momentum persists. In the opposite direction, the (S1) 4.230 can be used as the first stop if selling orders are to increase. However, lower we note the (S2) 3.980 and the (S3) 3.590 levels. The range between the (S2) and the (S3) levels is highlighted with grey on our chart and seems to be critical as it can become a target if bearish interest arises. The (S3) 3.590 is the lowest level reached since the past June, making it an indicator for the selling side in the scenario of a strong selling trend. Traders should keep an eye out for Thursday’s EIA Natural Gas Storage levels that will be released in the US session.
#TSLA Gráfico 1H
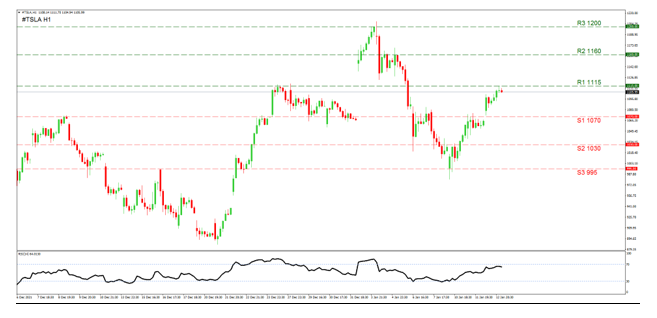
Tesla is among the stocks that has surged higher notably in the current week and has regained much of the ground lost in the past week. Tesla rose and tested the (R1) 1115 resistance level but did not manage to break above it. This line has been tested previously as a resistance on the 27. and 28. of December, proving this level is recognized by traders. A possible move above the (R1) could make way for the (R2) 1160 line to be aimed at as it was previously used as a resistance in the first days of the month. At the top, we have noted the (R3) 1200 round number level and this was clearly tested on the 3 of January but the price action returned lower.
The levels we have noted if the trend is to turn downwards are the (S1) 1070 support, the (S2) 1030 level and the (S3) 995 line. The (S1) is a level previously used as a resistance and a support thus can turn out to be the first test for the bears. Lower the (S2) 1030 can be the next target lower. However, the most significant support is the (S3) 995 which was tested on the 10. of January but not breached and remains the lowest level tested in the current month. Since its test of the (S3), Tesla has rebounded and moved into the current upward momentum. The RSI indicator below our chart seems to be hovering just below 70, giving the sentiment that the buying in the past session may have eased. Please note Tesla’s earnings report for the Q4 will be released on the 26. of January making that date a star on our calendar.
XAG/USD H4
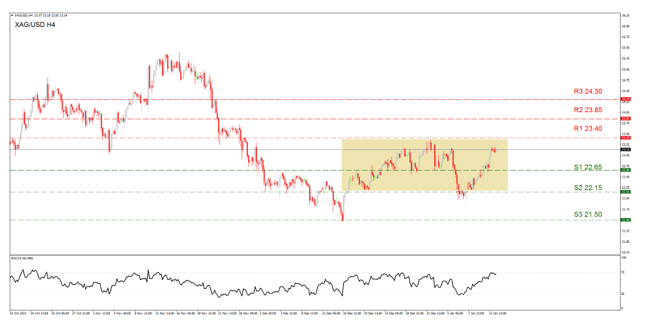
Silver has moved in an upward trendline since bouncing off the (S2) 22.15 support level on the 7. of January. However, Silver is currently moving in a wider sideways motion between the (R1) 23.40 and the (S2) 22.15 support level and this range is highlighted with light yellow on our chart. This range could be critical for decision making and we suggest that traders consider if for future reference. If the price action breaks above this range we note the (R2) 23.85 support level as the possible stop higher while the (R3) 24.30 can be the top in the short term, if an extensive buying scenario is to unfold.
To the downside we note first the (S1) 22.65 and below it the (S2) 22.15 which remains a monthly low. At the end the (S3) 21.50 stands as the lowest level observed since July 2020, making it an impressive and significant support line. The RSI indicator below our chart seems to have reached the 70 line and possibly forming some stabilization for the time being. As a precious metal, Silver can move with important financial releases and especially from the US. On the 14. of January we get the very important US retail sales figures and the Industrial Production rates both for December. Finally, also on the 14. we get the Preliminary University of Michigan economic sentiment figure for January.
AUD/USD H4
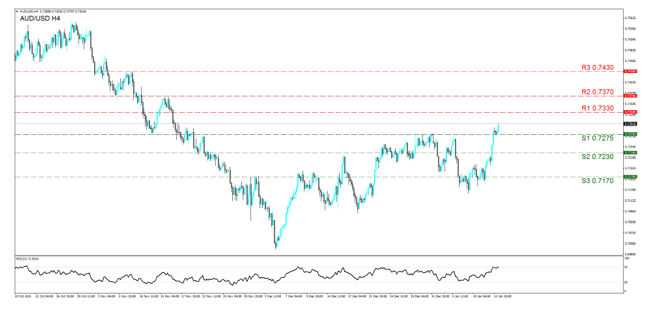
On a weekly basis, AUD/USD has made the largest movement among the major forex pairs for the time being. AUD/USD is currently running in an upward momentum and has breached the sideways price range it was moving within, between the (S1) 0.7275 and the (S3) 0.7170 support levels. If the upward momentum continues then in our opinion the forex pair can catch up with the (R1) 0.7330 resistance level first, while a move higher can also turn attention towards the (R2) 0.7370 level. Our highest target for a bullish scenario is set at the (R3) 0.7430 level as this was last used as a high in November.
The RSI indicator below our chart seems to remain in an ascending trend above the 70 line, indicating some buying interest may persist currently. No major economic data will be released from Australia in the following days, yet the Chinese economic data coming out is rather important and can move the Aussie. On the 14. of January we get the Chinese Trade balance for December and on the 17. of January we get the Industrial Output and Retail Sales for December along with the Q4 GDP rates. Finally, traders should also keep in mind the US news indicated during the Silver analysis.
Si tiene preguntas generales o comentarios relacionados con este artículo, envíe un correo electrónico directamente a nuestro equipo de investigación a research_team@ironfx.com
Descargo de responsabilidad:
Esta información no debe considerarse asesoramiento o recomendación sobre inversiones, sino una comunicación de marketing. IronFX no se hace responsable de datos o información de terceros en esta comunicación, ya sea por referencia o enlace.


