
WTI’s appears to have moved higher since our last report, yet appears to be moving in an sideways fashion at this point in time. Currently, we tend to focus on the situation of the US oil market and also keep an eye out on the situation between Venezuela and Guyana, as well as the rising tensions between Armenia and Azerbaijan. In this report, we aim to shed light on the catalysts driving WTI’s price, assess its future outlook and conclude with a technical analysis.
Oil: Overview Report
Tensions simmer below the surface between Armenia and Azerbaijan
Tensions between Armenia and Azerbaijan appear to be increasing, with concerns about the possibility of a full-out war between the two nations, appearing to be on the rise. In particular the Prime Minister of Armenia, Nikol Pashinyan stated that his government’s analysis was that Azerbaijan was preparing for a full-scale war against Armenia. A potential war could impact oil prices, as Azerbaijan’s status as an exporter of oil into Europe has increased in importance ever since the war in Ukraine occurred.
Therefore, in the event of escalating tensions in an already volatile region, oil prices could move higher as oil supply chain sources could be disrupted. However, the possibility of a war does not appear to be impacting oil prices at this point in time, yet it may be worth keeping an eye out for in the coming months. In conclusion, another war could lead to elevated oil prices.
US Oil drillers wary of waning demand for oil?
US oil drillers appear to be reducing oil production, potentially fearing a contraction in demand for oil in the foreseeable future. In particular the Baker Hughes total oil rig count last Friday came in at six hundred and twenty one which is only two fewer oil rigs compared to the previous week. However, for the same time period last year, the total rig count stood at a much higher, at seven hundred and sixty total oil rigs, therefore highlighting our aforementioned concerns.
Furthermore, the API weekly crude oil inventories figure which was released yesterday came in at seven point one six eight million barrels, which was higher than the expected figure of four point two nine eight million barrels, implying a reduction in demand which in turn led to an increase in oil inventories.
Therefore, should the EIA weekly crude oil inventories figure which is due to be released later on today, confirm the API’s figure of an increase in oil inventories, it could validate the implication of a reduction in demand thus potentially weighing on oil prices. In conclusion, should further indications arise which imply a potential reduction in demand for oil, it could weigh on oil prices. Whereas should the aforementioned scenario, appear to be temporary, we may see some support for oil prices down the line.
Venezuela and Guyana
Tensions between Venezuela and Guyana appear to be heating up once again, and in particular Venezuelan President Maduro stated on Monday that Exxon Mobil (#XOM) would not be entering “this sea” referring to the area in the disputed Essequibo region, in which Exxon Mobil discovered massive oil reserves. For some context, Exxon Mobil produces roughly six hundred and fourty five thousand barrels a day from Guyanese waters, which is a massive feat considering zero barrels per day were being produced just five years ago.
As such, should tensions escalate further between the two nations, it could potentially drive oil prices higher, as the availability of oil supply to the global oil markets could be reduced. However, we should note that the Government of Guyana is attempting to de-escalate the situation, by asking the International Court of Justice to rule on the matter.
Oil: Technical Analysis
WTI Cash H4
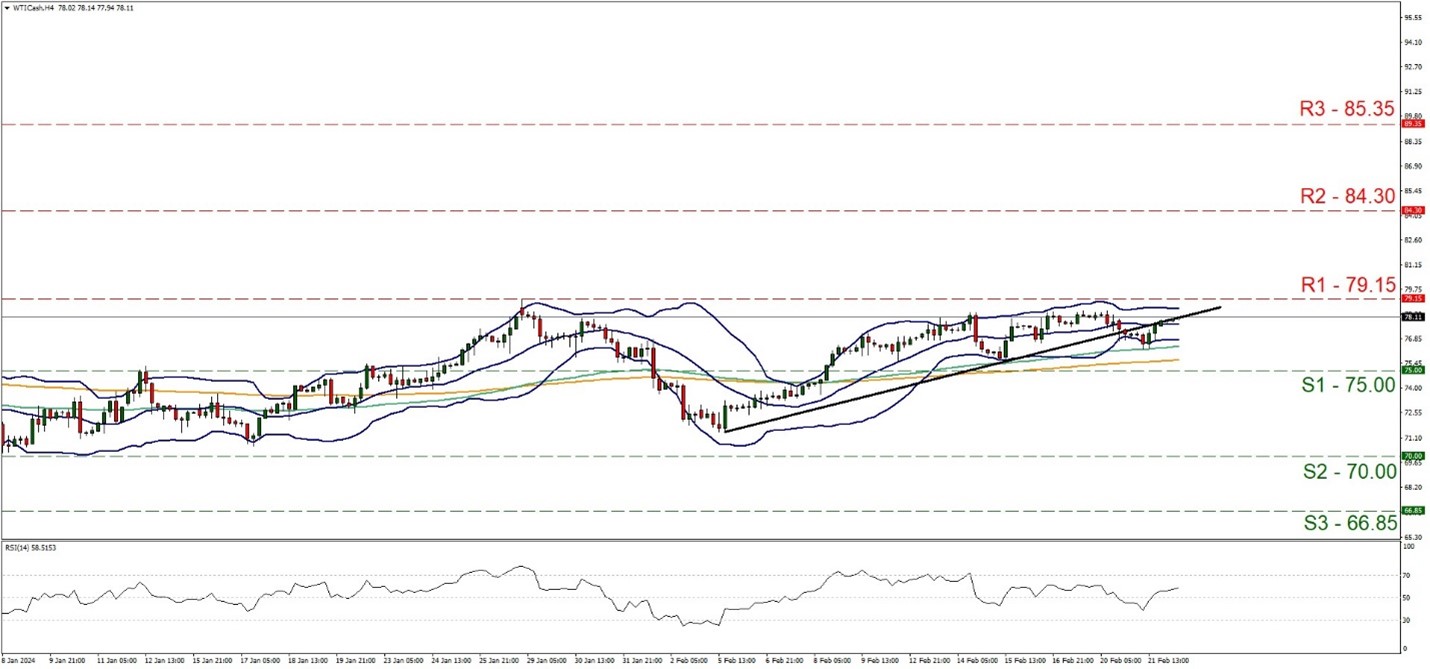
- Support: 75.00 (S1), 70.00 (S2), 66.85 (S3)
- Resistance: 79.15 (R1), 84.30 (R2), 85.35 (R3)
WTI’s price has risen since our last oil report breaking the 75.00 resistance line, now turned to support, yet was not able to test the seventy nine point fifteen resistance level stabilizing somewhat. We tend to maintain a bias for a continuance of the current sideways motion, between the 75.00 support line and the seventy nine point fifteen resistance level, for the time being, as the upward trend line that was guiding the commodity’s price since the 5. of February, has been broken, signaling the interruption of the upward movement.
We also note the narrowing and flattening of the Bollinger bands implying an easing of market volatility for WTI, which could allow the sideways motion to continue. On the other hand, the RSI indicator remains above the reading of fifty, implying some bullish predisposition of the market, yet seems to remain unconvincing at the moment. For a bullish outlook, we would require the liquid gold’s price to break the upper boundary of its current sideways motion, namely the seventy nine point fifteen resistance line and take aim at the eighty four point thirty resistance hurdle, which has not experienced any price action since the end of October last year.
For an extremely bullish scenario, we would note the eighty five point thirty five resistance barrier. Should on the flip side the bears find a chance to take over, we may see the commodity’s price breaking the 75.00 support line and aim for the 70.00 (S2) support base. Even lower we note the sixty six point eight five support level which had formed a floor for WTI’s price action in late May/early June last year.
Descargo de responsabilidad:
Esta información no se considera un consejo de inversión ni una recomendación de inversión, sino una comunicación de marketing


