
Markets still in turmoil as investors remain on edge following renewed geopolitical tensions and fresh signals from the US economy.
President Trump’s latest threats toward Iran have raised fears of potential escalation, especially around the Straits of Hormuz, increasing uncertainty across global markets and energy prices.
At the same time, stronger-than-expected US employment data has boosted the USD and reinforced expectations that the Fed may keep interest rates higher for longer, keeping traders focused on upcoming inflation releases and key economic indicators.
Trump’s threats haunt the markets
Markets are still in turmoil after US President Trump’s threats on Iran, in his post on Truth Social yesterday.
The US President threatened Iran with a resuming of air strikes against energy facilities should it not agree to a ceasefire deal by Tuesday. Specifically, the reopening of the Straits of Hormuz are a major issue, yet Iran does not seem willing to allow free passage.
Possible US and Israeli air strikes on Iranian energy and transport infrastructure are expected to trigger a similar reaction by Iran on energy installations of other Gulf countries. Overall, the possibility of an escalation of the war in Iran tends to enhance uncertainty in the markets. Nevertheless, oil prices are correcting lower after rallying on Thursday.
March’s US employment report hardens Fed’s stance
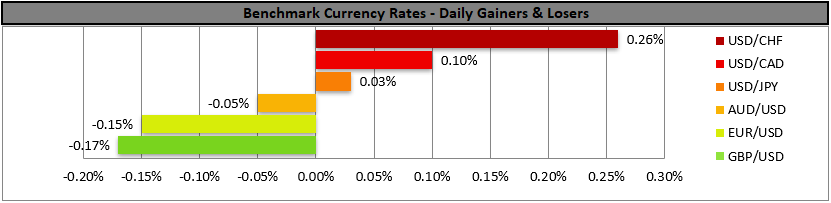
Also we note the strengthening of the USD in the FX market on Friday as the greenback got a boost from the better-than-expected US employment data for March.
The release highlighted a tightening of the US employment market over the past month.
Market expectations for the Fed remaining on hold for longer tended to be enhanced which in turn was supportive for the USD, while temporarily halted US equities bulls as US Equities markets reopen. We highlight the release of the US PCE and CPI rates for February and March on Thursday and Friday, while the Fed is to release its March meeting minutes shaking the markets.
Otros destacados de hoy
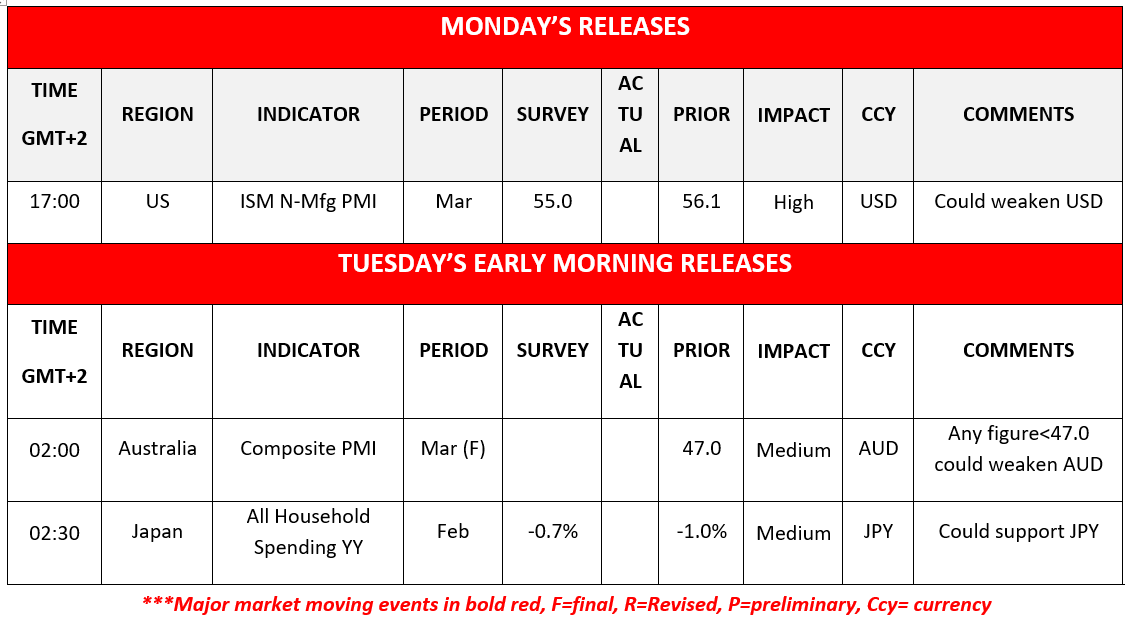
Today we get the US ISM non-manufacturing PMI figure for March. In tomorrow’s Asian session, we get Australia’s final composite PMI figure for March and Japan’s All household spending for February.
On Tuesday, we get Euro Zone’s Sentix index for April and the US durable goods orders for February.
On Wednesday we get from Japan the current account balance for February, from New Zealand RBNZ’s interest rate decision, Germany’s industrial orders for February and UK’s Halifax House prices for March. On Thursday we get Germany’s industrial output for February, the final US GDP rate for Q425 and the weekly US initial jobless claims figure.
On Friday we get Japan’s PPI rates, China’s inflation metrics, Canada’s employment data all for March, the US factory orders for February and the preliminary US UoM indexes for April.
Charts to keep an eye out
WTI
WTI’s price corrected lower in today’s Asian session and the breaking of the 112.70 (R1) resistance line proved to be temporary. Yet the push higher WTI’s price enjoyed was decisive allowing the commodity’s price to form a new higher peak.
We tend to maintain a bullish outlook for WTI’s price action, as long as the upward trendline guiding it remains intact. Should the bulls remain in charge as expected, we may see WTI’s price breaking the 1112.70 (R1) resistance line, clearly this time, and continue to higher aiming for the 119.50 (R2) resistance level.
Should the bears take over, we may see WTI’s price breaking the 107.00 (S1) support, the prementioned upward trendline in a first signal of an interruption of the upward movement and start aiming if not reaching the 93.80 (S3) support level.
Dow Jones
Dow Jones despite opening lower seems to be regaining the losses as the American session is about to start.
Since the breaking of the downward trendline guiding it on the 31 of March, the index’s price action has stabilised somewhat between the 47150 (R1) and the 45750 (S1) levels, implying a wait and see stance of US equity holders and a sideways motion for the index.
Should the bulls take over, we may see the index breaking the 47150 (R1) resistance line and start aiming for the 48350 (R2) level. Should the bears take over, we may see the index breaking the 45750 (S1) level and start aiming for the 444580 (S2) level.
WTI Daily Chart

- Support: 107.00 (S1), 100.90 (S2), 93.80 (S3)
- Resistance: 112.70 (R1), 119.50 (R2), 127.00 (R3)
US 30 Cash Daily Chart

- Support: 45750 (S1), 44580 (S2), 43320 (S3)
- Resistance: 47150 (R1), 48350 (R2), 49600 (R3)
Descargo de responsabilidad:
Esta información no debe considerarse asesoramiento o recomendación sobre inversiones, sino una comunicación de marketing. IronFX no se hace responsable de datos o información de terceros en esta comunicación, ya sea por referencia o enlace.