
Gold’s price seems to have hit a ceiling at the all-time high level of 2195, yet it’s still too early to judge whether the bulls gave up or are just taking a break after the steep ascent of the past week. Today we are to discuss the fundamental challenges laid ahead for the precious metal, while we will be concluding this report with a technical analysis of gold’s daily chart.
The Fed’s monetary policy
On the ever-interesting monetary front, for gold traders, we have entered the blackout period before the Fed’s 20. of March interest rate decision. For the time being the market’s expectations are for the bank to start cutting rates in the June meeting and deliver four rate cuts until the end of the year.
The market expectations tend to weaken the USD and at the same time support gold’s price as they are considered dovish. Yet Fed policymakers tended to push back against the market’s expectations implying a degree of uncertainty on behalf of the Fed for the path of US inflation. It’s characteristic that Fed Chairman Powell in his testimony before the US Senate recognized the need for rate cuts within the year, confirming the market’s expectations, yet also highlighted the uncertainty for the outlook of inflation.
Overall, the release allowed for gold’s price to reach new record highs, as the confirmation that rate cuts are coming seemed predominant.
Gold, USD and US Yields
Since our last report, US yields tended to edge lower polishing further the appeal of the precious metal if contrasted to US bonds as a safe-haven instrument. We expect that the inverse relationship between US yields and gold’s price may continue to influence the path of the precious metal’s price.
Similarly and linked in a more obvious fashion, would be the negative correlation of the USD and gold’s price as the weakening of the USD against its counterparts, may have allowed for gold’s price to advance higher since our last report. At this point, we note that the release of the US CPI rates for February later today is to be the next big test for gold’s price. A possible failure of the US CPI rates to slow down materially could imply a persistence of inflationary pressures in the US economy, adding pressure on the Fed to keep rates high for longer and thus weakening gold’s price.
We also note the release of the US retail sales for February on Thursday, as another release that could potentially create some volatility for gold’s price.
Regional tensions continue to support gold’s price
On an international level, we note that regional tensions on a military level, seem to remain pretty much active, increasing uncertainty in the global market. We note currently, the war in Ukraine, the Israel bombing of Gaza, the Houthi rebel activity in the Red Sea and the Gulf of Oman but also the less mentioned in media Venezuelan intentions to annex large parts of Guyana, the unrest in Haiti and the tensions in the Taiwan straits.
The overall uncertainty is also enhanced by the political outlook of the US, which hangs in the balance of the November presidential elections. Overall, we tend to maintain the view that geopolitical tensions provide support for gold’s price as they could potentially increase demand for the precious metal.
Gold: Technical Analysis
XAUUSD Daily Chart
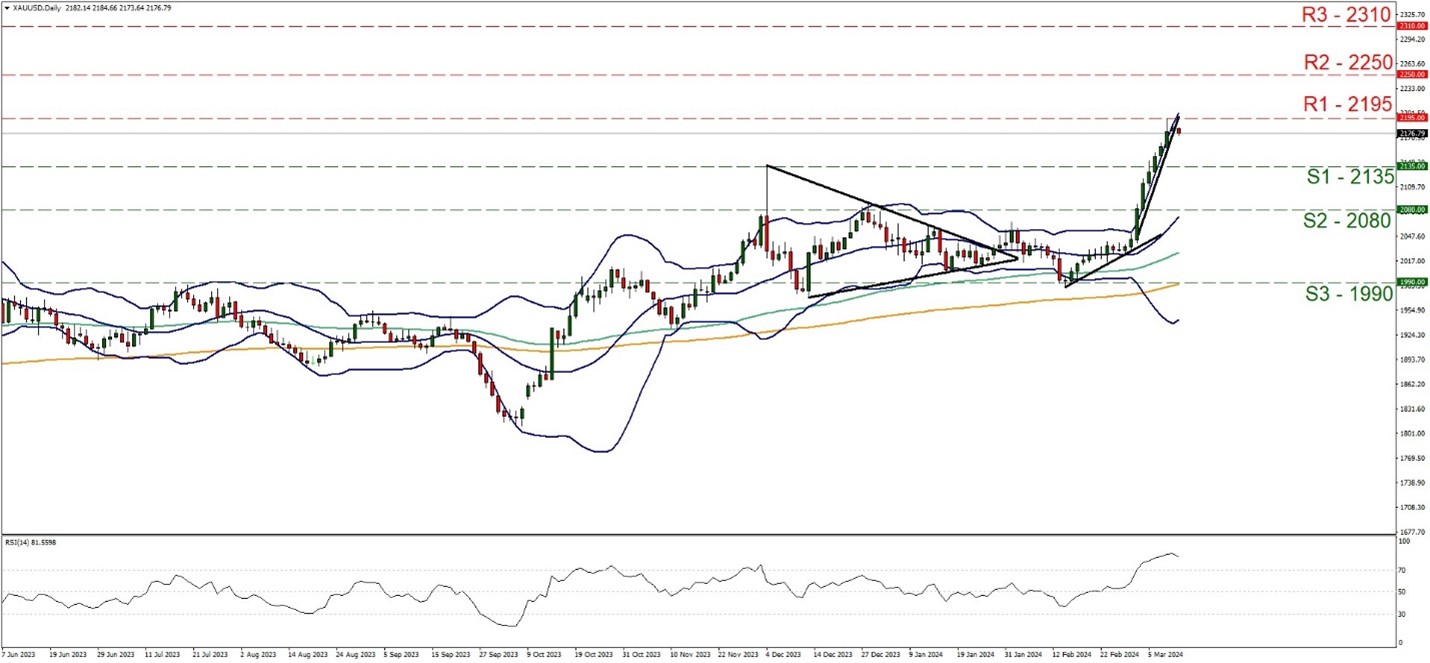
- Support: 2135 (S1), 2080 (S2), 1990 (S3)
- Resistance: 2195 (R1), 2250 (R2), 2310 (R3)
After our last report, gold’s price continued to rally forcing us to recalibrate the resistance and support levels. For the time being, we note that the precious metal’s price has marked a new all-time high at the 2195 (R1) resistance line and has hit a ceiling, before correcting lower in today’s Asian session. In its correction lower the pair has broken the upward trendline guiding it, thus suggesting that a switch of the bullish outlook in favour of a sideways motion bias is in order for the precious metal currently. Yet the RSI indicator remains above the reading of 70 implying a continuance of the bullish market sentiment for gold’s price.
At this point, we would also note that the distance created between gold’s price action and the upper Bollinger band could allow some room for the bulls to play. Yet for the bullish outlook to be renewed we would require gold’s price to form a new record high by breaking the 2195 (R1) resistance line and we set the next possible target for the bulls at the 2250 (R2) resistance level. On the flip side should the bears find a chance and take over, we may see gold’s price sinking to its former all-time high level 2135 (S1) now turned to support, breach it and thus pave the way for the 2080 (S2) support base.
Descargo de responsabilidad:
Esta información no se considera un consejo de inversión ni una recomendación de inversión, sino una comunicación de marketing


