
The Gold market shied away from significant price action in the past days possibly hinting that traders are waiting on very important events or outcomes to engage the market. The following days certainly keep important economic events in store for traders, thus we expect liquidity to increase. This report aims at providing Gold traders with the most valuable information on how to trade and stay protected in the Gold market. Our closing will include Gold’s charting insights with important technical levels identified.
With the US Dollar keeping an adverse relationship with Gold’s price, traders tend to focus more on how the US economy is performing currently and what conclusions they can derive from the data released so far. In the past days, Gold’s most exciting day unfolded during the US employment report that was released during the previous Friday. The unemployment rate dropped very notably from 5.2% to 4.8% indicating some positivity landing the lowest unemployment rate since the pandemic started. On the other hand the Non-Farm Payrolls figure came in just at 194K pointing out that US jobs growth stalled for a second straight month. Moreover the average earnings growth figures showed an increase on both the yearly and monthly metric. Even though most emphasis was placed on the NFP figure that mostly disappointed traders going much lower than forecasted, we could say that the report displayed a rather positive picture for the US economy. Gold jumped higher by approximately $20 upon release of the figures yet a few hours later corrected to levels previously seen. In our view, the event failed to meet expectations yet the figures may have not allowed for anything more.
Traders will be keeping their eyes firmly on the US Inflation data to be released in the US session on the 13. of October. Gold is one of the most favorable instruments to use when inflation data is about to hit, as the yellow metal can be used as a form of hedge for rising prices. Gold traders are expected to react to the release and opportunities may present themselves unexpectedly thus traders are advised to be prepared. On the same day and later in the US session we get the FOMC meeting minutes which will be a review of the FED meeting that took place in September. With this event, traders will also be on the lookout for any update on the views of the Fed on inflation, tapering its QE program or even future forecasts. With the combination of the two events highlighting Wednesday’s US session, the Gold market could be in for a treat yet caution is advised.
In the days ahead a number of US economic data can be used as possible Gold market volatility. On the 14. of October we get the weekly Initial Jobless Claims figure while on the 15. we get the Retail Sales figure for September along with the Preliminary Uni. Michigan Economic Sentiment figure for October. On the 18. of October we get Industrial Production rates and on the 19. we get the Housing Starts Number both readings for September. On a separate note Gold traders will have to keep their eyes on the bond market as yield volatility can signal Gold price movement.
As a closure we would like to raise attention to the energy market that is currently seeing prices rise substantially with demand far exceeding supply. Energy costs have the effect of dragging consumer prices higher thus economic risk could remain elevated in these circumstances and Gold prices can react to such a scenario.
Análisis técnico
XAU/USD H4
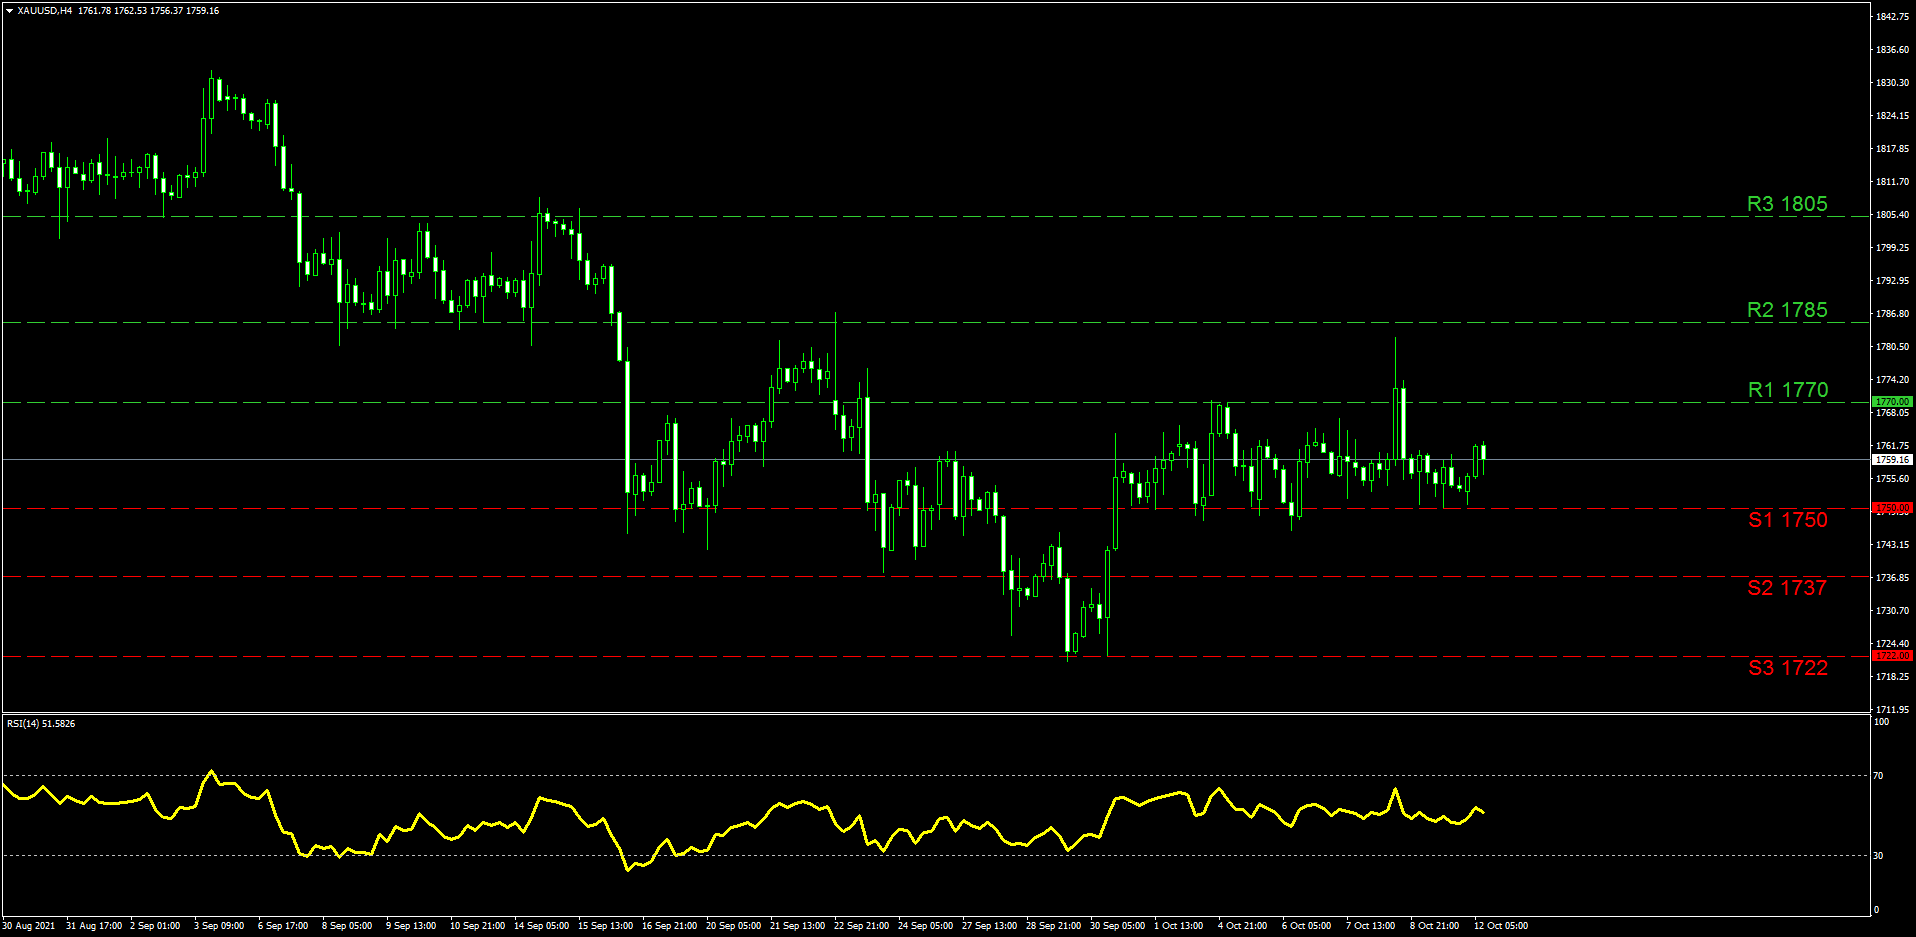
At the moment we are seeing a prolonged sideways motion between the (R1) 1770 resistance and the (S1) 1750 support that has formed since the start of October. The only breach above the (R1) was seen during the previous Friday when the NFP figure was released forcing a buying momentum to unleash. The movement made way for the (R2) 1785 level to become a target but the level was not tested in the end. The (R3) 1805 stands above all our resistances and can be a good mark for an extended bullish strategy. In the scenario of a downward movement the (S1) 1750 will be tested first, a level that has not been clearly broken so far in October. Lower than that the (S2) 1737 level is also imminent while our lowest support is currently the (S3) 1722 which is the bottom formed previously in September. The RSI indicator follows the sideways motion moving nearby the 50 level. Yet as the indicator remains above 50 it could be a sign that some limited bullish interest may be present. Yet we could say the recent sideways motion in October has put a halt to the downward trend Gold’s price was in for the past months.
Si tiene preguntas generales o comentarios relacionados con este artículo, envíe un correo electrónico directamente a nuestro equipo de investigación a research_team@ironfx.com
Descargo de responsabilidad:
Esta información no debe considerarse como un asesoramiento o recomendación sobre inversiones, sino únicamente como una comunicación de marketing.


