
US stock markets moved higher with the Nasdaq,S&P 500 and Dow Jones moving higher since last week .In today’s report we are to discuss the ongoing trade deal bonanza, Microsoft’s recent vulnerability and conclude the report with a technical analysis of S&P 500’s daily chart.
Trade deals in the spotlight
The US’s August 1st tariff deadline is looming and with just over one week to go until they go into effect, some nations are still trying to reach a deal with the US. Yet with the tariff deadline looming some nation’s have managed to secure a trade deal with the US.In particular, President Trump stated on his TruthSocial account yesterday that “We just completed a massive Deal with Japan, perhaps the largest Deal ever made. Japan will invest, at my direction, $550 Billion Dollars into the United States, which will receive 90% of the Profits” and that “Japan will pay Reciprocal Tariffs to the United States of 15%”. In turn the announcement of the trade deal with Japan has spurred a positive market sentiment that further trade deals may ensue prior to the August 1st deadline. Specifically, optimism is rising that the EU may secure a trade deal with the US prior to the deadline, with President Trump stating per CNBC that “We have Europe coming in tomorrow, and the next day, we have some other ones coming in”. Thus the comments by President Trump may have provided support to both the European and American Equities markets. Furthermore, US Treasury Secretary Scott Bessent stated that “We are making good progress with the EU,” which may have further improved the positive market sentiment.However, the EU is also preparing for a “no-deal” scenario with Bloomberg reporting today that the EU has readied a 30% tariff on approximately $117b worth of US goods. Nonetheless, the possibility of a trade deal occurring with the EU prior to the deadline may have provided support for the US Equities markets. Although should a deal not occur it could have the opposite effect. In our opinion, the EU may be unwilling to provide the US with the sort of trade deal it requires, yet could offer other forms of concessions to avoid the 30% tariff being implemented on the 1st of August.
Microsoft (#MSFT) “SharePoint” vulnerability emerges
Microsoft issued an alert on Saturday about “active attacks” on self hosted SharePoint servers. The hack appears to have been a “zero-day” exploit and has allegedly been carried out by Chinese state-backed groups and has per Reuters affected roughly 100 organizations which include some government’s according to the Shadowserver Foundation. The degree and severity of the exploit does not appear to have been fully analyzed at the time of this report and thus should a wide variety of company servers find themselves compromised and face further cyber attacks, it could potentially weigh on Microsoft’s (#MSFT) stock price if they fail to take swift action or if more exploits are discovered.
Earnings reports ahead
We make a start with the earnings paragraph today by noting that Verizon’s (#VZ) earnings are due out on Monday, LockheedMartin(#LockheedMT) and General Motors (#GM) on Tueday, Tesla (#TSLA), Google (#GOOG) and IBM (#IBM) on Wednesday followed by Deutsche Bank (#DB) and Intel (#INTC) on Thursday and ending the week is Volkswagen (#Volkswagen) on Friday.
Análisis técnico
US500 Daily Chart
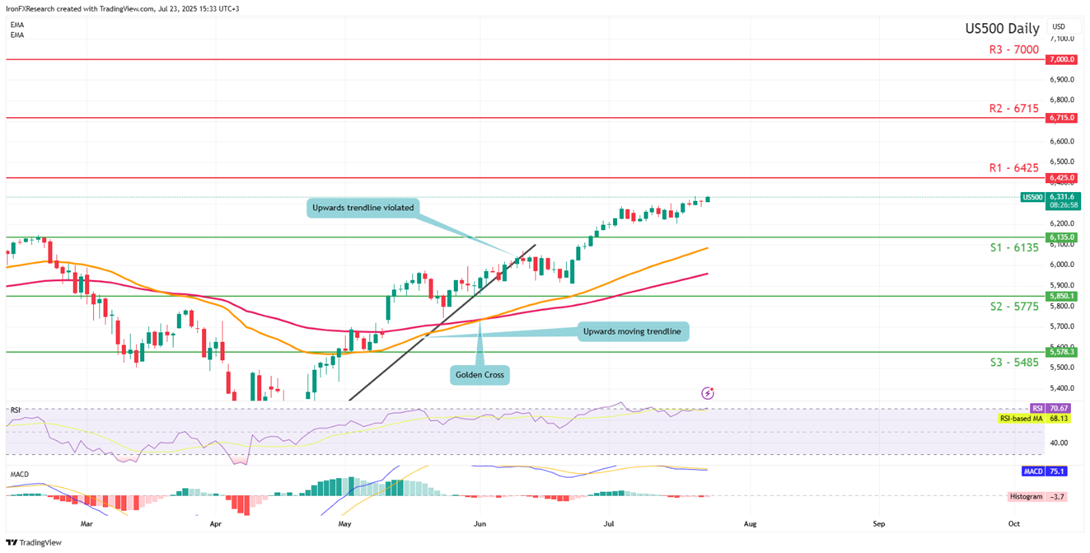
- Support: 6135 (S1), 5850 (S2), 5580 (S3)
- Resistance: 6425 (R1), 6715 (R2), 7000 (R3)
S&P 500 appears to be moving in an upwards fashion with the next possible target for the bulls being the 6425 (R1) resistance line. We opt for a bullish outlook for the index and supporting our case is the RSI indicator below our chart which currently registers a figure of 70 implying a strong bullish market sentiment. For our bullish outlook to continue we would require a clear break above the possible 6245 (R1) resistance line with the next possible target for the bulls being the 6715 (R2) resistance line. On the other hand for a sideways bias we would require the index to remain confined between our 6135 (S1) support level and our 6425 (R1) resistance line. Lastly, for a bearish outlook we would require a clear break below the 6135 (S1) support level with the next possible target for the bears being the 5850 (S2) support line.
Si tiene usted alguna pregunta o comentario sobre este artículo, escriba un correo directamente a nuestro equipo de investigación research_team@ironfx.com
Descargo de responsabilidad:
Esta información no debe considerarse asesoramiento o recomendación sobre inversiones, sino una comunicación de marketing. IronFX no se hace responsable de datos o información de terceros en esta comunicación, ya sea por referencia o enlace.


