Over the past week, there have been mixed signals from US stock markets and hesitation to advance higher. In this report, we are to discuss fundamentals that could be affecting US stock markets, add a small comment for Exxon Mobil and finally conclude with a technical analysis of the S&P 500.
The fundamentals and upcoming releases
On a fundamental level, we note that the market’s expectations for the Fed to proceed with consecutive rate cuts in the coming year seemed to intensify. The market expectations also tended to improve the market sentiment for Equities, as the restrictive financial environment may ease somewhat in the coming year. It’s characteristic of the market’s dovish expectations, that currently Fed Fund Futures imply that the bank may proceed with five rate cuts in 2024, while some analysts tend to mention the possibility of even six rate cuts. On the other hand, we tend to view the market’s expectations as possibly overextended. The Fed could proceed with rate cuts once it feels that inflationary pressures are under control and near if not just below the bank’s 2% target. Fed Chairman Powell’s speech last Friday was pivotal in the sense that despite the Fed Chairman stating that the rates are well in restrictive levels implying that the Fed is done with hiking rates, also tended to imply that the bank may keep rates at high levels for a prolonged period. Yet Powell failed to convince the markets and its characteristic that all three major US Stockmarket indexes, namely the Dow Jones, S&P 500 and Nasdaq ended the day in the greens, despite some hesitation. Should the market’s expectations for a considerable easing of the bank’s restrictive monetary policy in 2024, intensify, we may see stock markets being on the rise once again and vice versa. Overall we note the absence of any statements of Fed policymakers in the coming week given the blackout period before the bank’s 13. of December interest rate decision, hence we expect equities to be led by fundamentals as well as financial releases due out. The highlight of the week is expected to be the release of the US employment report for November on Friday. Should the release take the markets by surprise we may see it having ripple effects in US equities as well. If the data show an easing of the US employment market’s tightness, adding more pressure on the Fed to proceed with rate cuts earlier, that could provide some support for US stock markets and vice versa.
Exxon Mobil’s merger faces headwinds
We have been keeping our eyes on the almost $60 billion merger announced by Exxon Mobil (#XOM) and Pioneer in the last days of October, an issue that we had mentioned in a prior report. The merger was a mega deal in the sense that it would magnify the potential of Exxon Mobil in a widening of the lower level of its verticalized production and distribution structure. Yet there seem to be headwinds for the deal as the Federal Trade Commission (FTC), the US watchdog also for competition and consumers has some concerns. It’s characteristic that the Commission has requested for a second time details on the merger. Voices within the US Senate seem to oppose the merger or at least be worried about the issue. U.S. Senate Majority Leader Schumer (D) expressed his worries about a possible rise of oil prices from the merger and tended to push for the Commission to stop the merger should it find that it has breached antitrust laws. On the other hand, the companies stated that they are working with the FTC, and are optimistic that the deal is going ahead in the first half of 2024. Should there be signs of the merger actually being halted, we may see a bearish effect on Exxon Mobil’s (#XOM) share price and vice versa. In addition we note that Exxon Mobil seems to expect higher production levels for 2024, based on forecasts regarding the Permian base and Guyana. The latter seems to be facing doubt as Venezuela has been threatening to annex parts of the country in the past few days. The issue highlights the importance of Venezuela’s actions and its possible repercussions in the US oil market.
Análisis técnico
US 500 Cash 4 Hour Chart
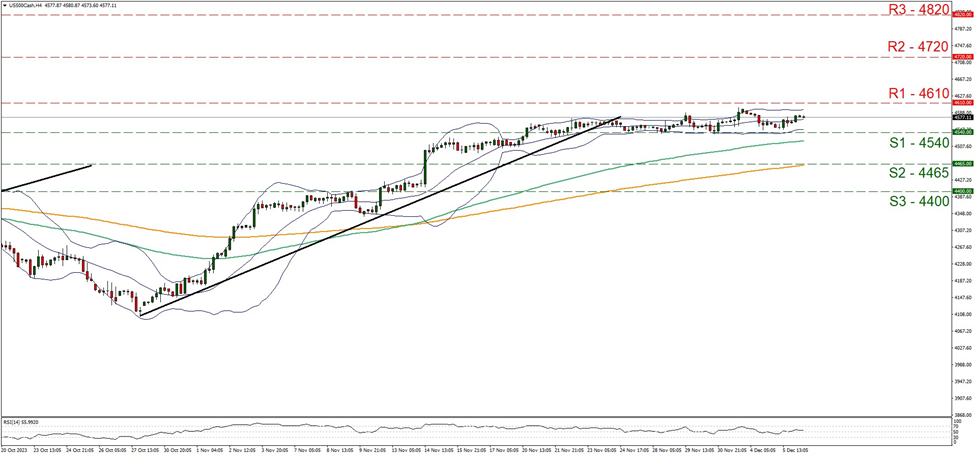
Support: 4540 (S1), 4465 (S2), 4400 (S3)
Resistance: 4610 (R1), 4720 (R2), 4820 (R3)
US 500’s price action remained in a relatively tight rangebound motion in the past week, between the 4540 (S1) support line and the 4610 (R1) resistance line. Given also that the RSI indicator continues to run along the reading of 50 implying a rather indecisive market that may allow the price action to maintain its current direction, we maintain our bias for the sideways motion to continue for the time being. Furthermore, we note that the Bollinger bands seem to widening a bit, in a sign that the price action may be slowly picking up a bit of volatility, yet the direction of the index’s next leg remains to be seen. Should the bulls regain control over the index, we may see the price action breaching the 4610 (R1) resistance line, which was tested in the last days of July and take aim of the 4720 (R2) resistance nest. Higher than that we also note the 4820 (R3) resistance hurdle. For a bearish outlook we would require the index to breach the 4540 (S1) support line which kept the index’s price action afloat in the past few days and aim for the 4465 (S2) support base. For a more extreme bearish scenario we note the 4400 (S3) support barrier.
Si tiene preguntas generales o comentarios relacionados con este artículo, envíe un correo electrónico directamente a nuestro equipo de investigación a research_team@ironfx.com
Descargo de responsabilidad:
Esta información no debe considerarse asesoramiento o recomendación sobre inversiones, sino una comunicación de marketing. IronFX no se hace responsable de datos o información de terceros en esta comunicación, ya sea por referencia o enlace.


