All eyes were fixed on the Gold market in the past days as it lost considerable ground performing its strongest one day selloff on Monday. The very notable selling momentum could be a signal that a considerable change has taken place in the markets and this report aims at investigating the most dominant gold market fundamentals, as we aim to assist traders with valuable information. As a closure, we will perform a technical analysis identifying important levels and possible price action scenarios.
To start with, the much anticipated decision on the Federal Reserve’s head was carried out on Monday the 22 of November, when US President Joe Biden backed Federal Reserve Chair Jerome Powell for a second term. At the same time, Lael Brainard had also been appointed Vice Chair of the Fed. Upon release of the news the USD Index was lifted to a 16 month high price displaying investors and traders saw confidence in keeping the Fed’s policy unchanged, with J. Powell as chairman. Gold dropped on the news as its antagonistic nature to the greenback made its way in the price action. Moreover, after Jerome Powell was confirmed to remain the Fed’s chair for the next 4 years, some analysts believe the sentiment of faster tapering of the Fed’s QE program and a sooner rate hike than analysts expect has returned to the market’s focus which may explain somewhat Gold’s movement to lower grounds. It’s worth noting that Interest rate hikes can possibly devalue the non-interest yielding bullion. Yet, according to Bloomberg as the Fed continues with Powell as Chairman, a risk on sentiment may be ignited despite the initial selloff of gold and the stock markets, on Monday. On a separate note, Silver’s reaction was similar to Gold’s basically inviting a bearish sentiment. It is worth keeping an eye on today’s US Preliminary PMI readings especially related to manufacturing and services as they can raise volatility for Gold and Silver, temporarily.
In the days ahead, traders have a rather active US session with a plethora of economic releases on the 24. of November, which in our opinion is definitely worth keeping an eye on. Early in the US session we get the US Durable Goods rate for October while simultaneously we get the GDP 2nd Estimate for Q3 and the weekly Initial Jobless Claims figure. Later on the same day we get the Core PCE Price Index rate for October which is monitored by the FED but also the Final University of Michigan Sentiment for November. Finally on Wednesday, we get the FOMC meeting minutes from its November 2 – 3, 2021 policy meeting. Thus Gold traders are recommended to be cautious on Wednesday the 24. with an interesting calendar covering the US session. However, in the next week on the 30. of November we get the very important US Consumer Confidence for November. On the 1 of December we get the Final Markit Manufacturing PMI and the very interesting ISM Manufacturing PMI both for November.
As a final note we must also consider the upcoming special events of Black Friday and Cyber Monday as even if not directly related to the Gold market, can be used by traders as an indication of confidence, possibly leading to volatility within the precious metal sector. Please note the performance of these events in terms of consumer demand and supply can provide important signals for the economy, especially as supply chain bottlenecks seem to persist in the short term.
Análisis técnico
XAU/USD H4
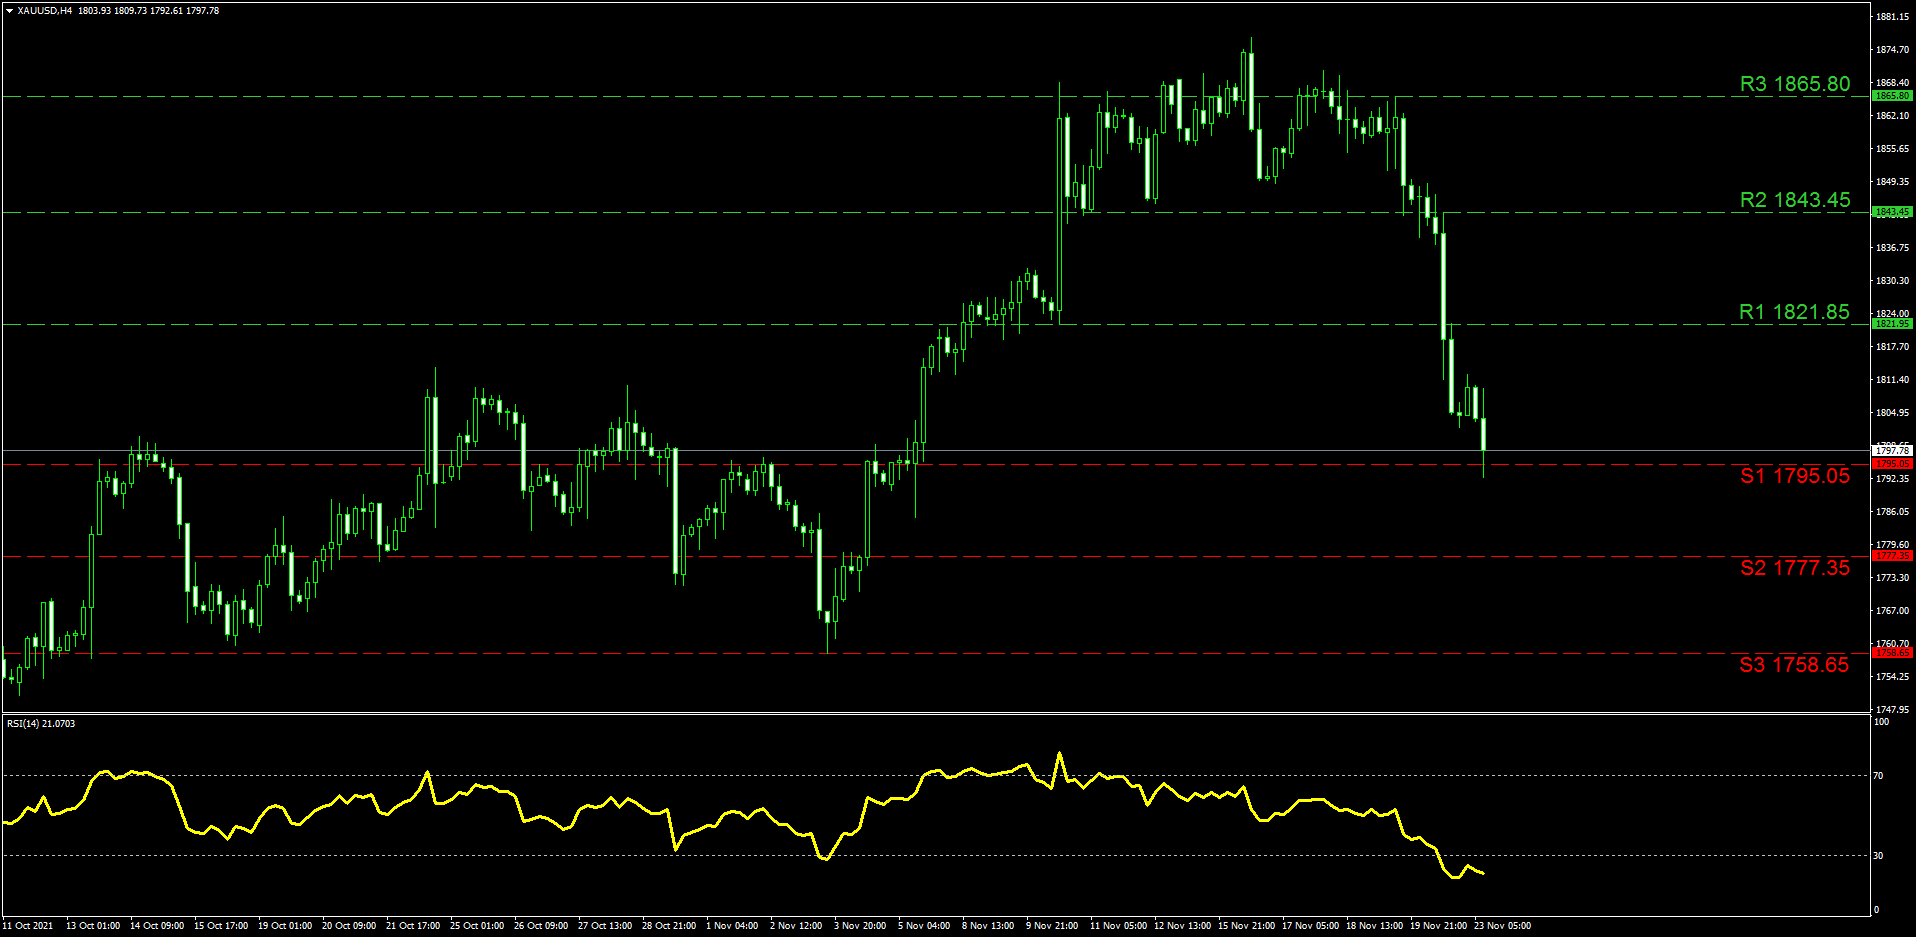
In the most recent sessions we have observed Gold testing the (S1) 1795.05 support which can be considered a signal that the selling orders are still in excess. The RSI indicator below our chart remains below 30, implying that the selling momentum formed since Monday has dominated Gold’s price action with very little evidence of stabilization so far. On the contrary, we could not dismiss the fact that the strong selling in the past sessions may be observed as an opportunity for traders to go long. In case the metal comes under some bullish interest we note the (R1) 1821.85 resistance as the possible first stop for the bulls while even higher the (R2) 1843.45 line stands firm used as both a resistance and support in the past. Our highest resistance is noted at the (R3) 1865.80 level which was tested various times in November yet the price action kept returning below it. In our view, the metal can be characterized being in a selling trend line for the time being with some sideways tendencies possibly to appear. If the trend continues then below the (S1), we note the (S2) 1777.35 support that was last tested in the beginning of November. However, the lowest level tested in November is currently noted as the (S3) 1758.65 support.
Si tiene preguntas generales o comentarios relacionados con este artículo, envíe un correo electrónico directamente a nuestro equipo de investigación a research_team@ironfx.com
Descargo de responsabilidad:
Esta información no debe considerarse como un asesoramiento o recomendación sobre inversiones, sino únicamente como una comunicación de marketing.


