


Since our last report, oil prices have moved sharply higher. In today’s report, we are to have a look at some key issues that tend to tantalise oil traders, primarily related to the recent geopolitical developments in the Middle East and the demand and supply factors of the US oil market. We are to complement the fundamentals with a technical analysis of WTI’s daily chart.
US-Iran tensions skyrocket with Israel looking to tango
At the time of this report, tensions are running high primarily between the US and Iran which have sent oil prices soaring. The recent tensions appear to be stemming from the comments made by the US President yesterday when asked if he will be able to convince Iran to shut down its nuclear program.
Specifically, the President stated that “”I don’t know. I did think so, and I’m getting more and more — less confident about it” and when referring to preventing Tehran’s development of nuclear weapons, Trump stated, “it would be nicer to do it without warfare, without people dying, it’s so much nicer to do it”.
Therefore, to sum up the President’s comments, negotiations with Iran on their uranium enrichment ambitions appear to be in deadlock, with the two sides finding difficulty in reaching an amicable solution. In return, Iran’s Defence Minister stated that “If a conflict is imposed on us … all US bases are within our reach and we will boldly target them in host countries”, which tended to intensify the concerns about a possible war between the two nations.
In our view, these comments are more or less posturing from both sides who are vying to gain some negotiation leverage or an attempt to boost their public image, i.e, Trump touting a tough stance on Iran and vice versa. The real issue in our opinion, is the mix of Israel into this showdown with media outlets claiming that Israel is considering the use of military force against Iran, without the support of the US. Hence, given Israel’s history with Iran, such a scenario may be more likely than a direct US-Iran confrontation.
From the market’s perspective, the possibility of a military escalation in the region may have increased concerns about the supply of oil into the global market, which in turn may have aided oil’s price. In conclusion, should military action occur in the region, either against Iran, the US or Israel, it may aid oil’s price.
Whereas, should it appear that steps are being taken to de-escalate the situation, it could weigh on oil prices. Yet, as we stated before, our view is that the risk of Israel deciding to strike Iranian targets may be the main concern for market participants.
US oil market signals relative tightness
Should an oil trader take a look at the status of the US oil market, they may observe a relative tightness. We make a start with the release of the weekly API crude oil inventories figure which showcased an unexpected drawdown in oil inventories by -0.370M barrels.
The unexpected drawdown showcased that demand may have exceeded supply, a theory which was supported by the release of the EIA weekly crude oil inventories, which tends to aid our narrative, as the release also showcased a drawdown of -3.644M barrels. In turn the aforementioned financial releases may have aided oil’s price during the week.
Yet we should note that last Friday the Baker Hughes oil rig count came in lower than the prior week’s figure at 442 which may imply that the producers are exceeding the oil demand in the US and may not require as many active oil rigs. Nonetheless, should next week’s financial releases continue to showcase a drawdown in US oil inventories it may be perceived as bullish for oil prices and vice versa..
Oil Technical Analysis
WTI Cash Daily Chart
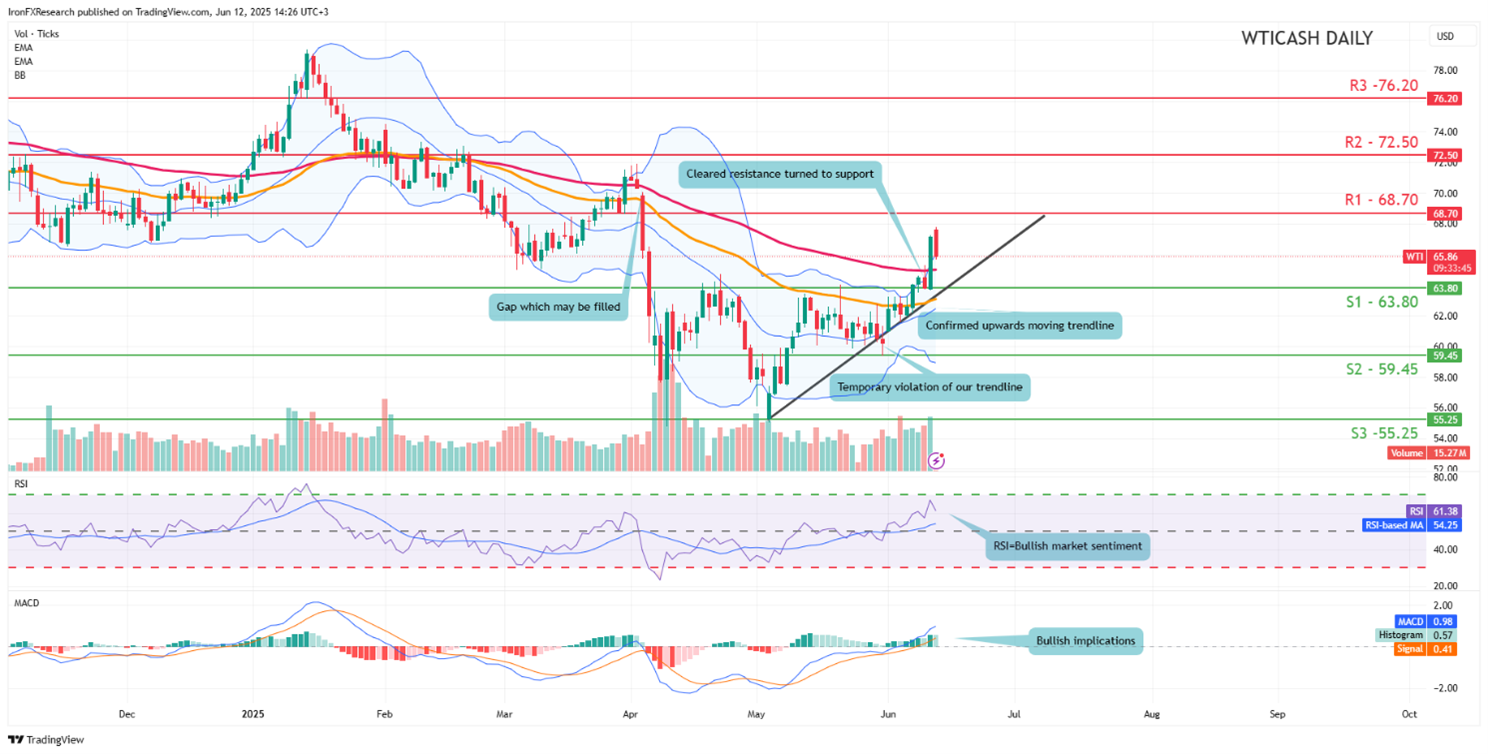
- Support: 63.80 (S1), 59.45 (S2), 55.25 (S3)
- Resistance: 68.70 (R1), 72.50 (R2), 76.20(R3)
WTI’s price appears to be moving in a predominantly upwards fashion. We opt for a bullish outlook for the commodity’s price and supporting our case are a variety of factors, starting with the upwards moving trendline which was incepted on the 5. of May, the RSI indicator which currently registers a figure close to 60 and lastly the MACD indicator.
However, that being said we would not be surprised to see the commodity’s price moving to test our 63.80 (S1) support level and given that the commodity’s price action has exceeded the upper band of the Bollinger bands, it may aid our opinion that oil’s price may be due a slight retracement to lower ground.
Nonetheless, for our bullish outlook to continue we would require a clear break above the 68.70 (R1) resistance line, potentially even “filling” our gap which we have annotated on our graph, with the next possible target for the bulls potentially being our 72.50 (R2) resistance level.
On the other hand, for a sideways bias we would require oil’s price to remain confined between the 63.80 (S1) support level and our 68.70 (R1) resistance line. Lastly, for a bearish outlook we would require a clear break below our 63.80 (S1) support level, if not also our aforementioned upwards moving trendline, with the next possible target for the bears being the 59.45 (S2) support level.
Descargo de responsabilidad:
Esta información no se considera asesoramiento ni recomendación para invertir, sino que es una comunicación de marketing


