S&P 500 continues to fall since our last report with the bears taking a break last Friday, yet the restarting their work from Monday onwards. In todays’ report we are to discuss main issues driving US stock markets lower on a fundamental level and compliment the report with a technical analysis of S&P’s 500 daily chart.
Trump’s tariffs enhance uncertainty
US stock markets sunk on Tuesday, as the US applied tariffs on Canadian, Mexican and Chinese products entering the country. Canadian and Mexican products were slapped with tariffs of 25%, while Chinese products were burdened with an additional 10% tariffs. Canada is to respond by applying immediate 25% tariffs on US beer, wine, bourbon, home appliances and Florida orange juice. Mexico stated that it will impose retaliatory tariffs on US with details coming Sunday. China on the other hand has announced additional tariffs of up to 10-15% targeting US farm products. Overall the tariffs may have an inflationary effect on the US economy forcing the Fed to maintain its hawkish stance and keeping rates unchanged for longer, a prospect that tends to weigh on US stock markets as tighter financial conditions will be prolonged in the US economy. Further more the application of tariffs and retaliatory action by targeted countries, enhances the uncertainty of the US, but also the global economic outlook which also tends to weigh on US stockmarkets. Last but not least do not rest assured that the US finished with tariffs, by applying them on Canadian, Mexican and Chinese products, economies such as the Euro Zone and Japan are next on the list enhancing uncertainty further.
Pessimistic for US economic outlook
Our worries for the outlook of the US economy intensified after the release of the Atlanta GDP for Q1 25 and the ISM manufacturing PMI figure for February on Monday. The Atlanta GDP rate predicts a steep contraction of the US economy in the first quarter of the year of up to -2.8%. Furthermore the ISM manufacturing PMI figure dropped from 50.9 to 50.3 and despite the figure being still at expansionary territory, the expansion of economic activity was achieved at a slower pace than expected which also tended to disappoint traders. Overall, the outlook for the US economy tends to be increasingly pessimistic or at best worries are growing, which in turn may weigh on US stockmarkets as investors become more cautious.
February’s employment data to shake the markets
On a macro-economic level, we note the wider than expected drop of the ADP national employment figure, implying that private sector employment is easing. Next Friday we highlight the release of the US employment report for February. Currently forecasts, show an expected rise of the Non-Farm Payrolls (NFP) to 160k if compared to January’s 143k, the unemployment rate to remain unchanged at 4.0% and the average earnings growth rate to also remain unchanged at 4.1%yoy. Should the actual rates and figures meet their respective forecasts, we may see the rise of the NFP figure and the stability of the unemployment rate, exciting traders and thus providing some slight bearish tendencies for US equities as the rise of the NFP figure may allow the Fed to maintain its doubts about another rate cut. Yet the actual rates and figures seldomly meet their forecasts, a possible loosening US employment market may provide some support for US Stock markets while on the flip side a possible substantial tightening of the US employment market could create bearish tendencies for US equities.
Análisis técnico
US500 Daily Chart
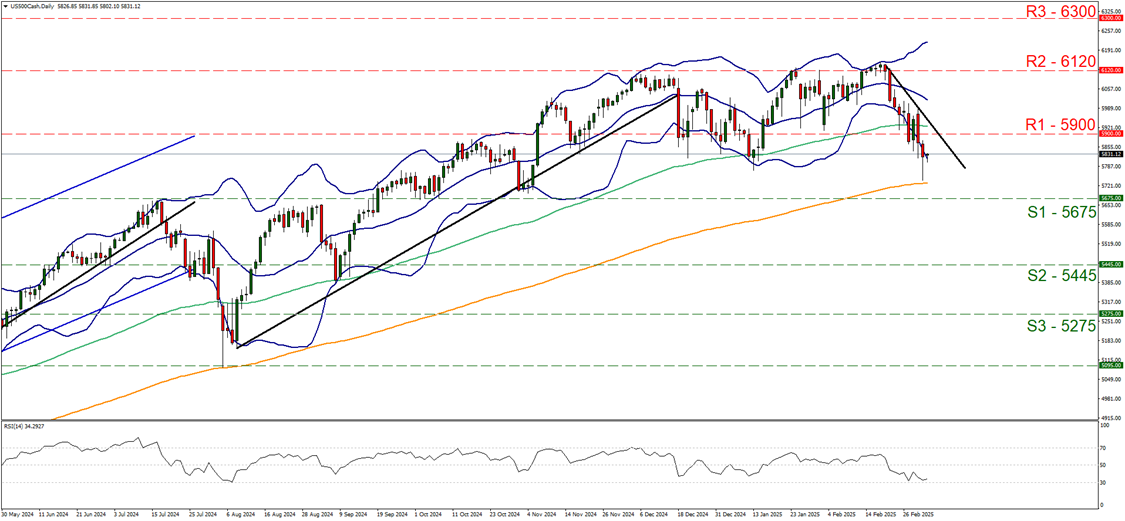
- Support: 5675 (S1), 5445 (S2), 5275 (S3)
- Resistance: 5900 (R1), 6120 (R2), 6300 (R3)
On a technical level, since our last report S&P 500 retreated breaking the 5900 (R1) support line now turned to resistance. Given the intensification of the index’s drop we maintain our bearish outlook for S&P 500 and intend to maintain it as long as the price action remains below the downward trendline, guiding S&P 500 since the 20. of February and we view any correction higher as temporary. We do though, also highlight two points of warries for the bears, the first being that the RSI indicator is nearing the reading of 30, implying that the index is approaching oversold levels and may be ripe for a correction higher. Similar signals come from the fact that the price action is constantly putting the lower Bollinger band to the test. Should the bears maintain control over the index as expected we may see it breaking the 5675 (S1) support line, thus paving the way for the 5445 (S2) support base. On the flip side, should the bulls take over, we may see the index’s price action reversing course breaking initially the prementioned downward trendline, in a first sign that the downward movement has been interrupted and continuing to break the 5900 (R1) resistance line and opening the gates for the 6120 (R2) resistance barrier that marks practically an all-time high level for the index.
Si tiene preguntas generales o comentarios relacionados con este artículo, envíe un correo electrónico directamente a nuestro equipo de investigación a research_team@ironfx.com
Descargo de responsabilidad:
Esta información no debe considerarse asesoramiento o recomendación sobre inversiones, sino una comunicación de marketing. IronFX no se hace responsable de datos o información de terceros en esta comunicación, ya sea por referencia o enlace.


