Watch daily commentary and make informed trading decisions

Register

Technical Analysis

All trading involves risk. It is possible to lose all your capital.
All trading involves risk.
It is possible to lose all your capital.

What is Technical Analysis?

Technical Analysis is the study of market action through the use of charts, in order to forecast future price trends. Market action includes: price, volume and open interest. Technical analysis can be used for short-term, medium-term and long-term trading.
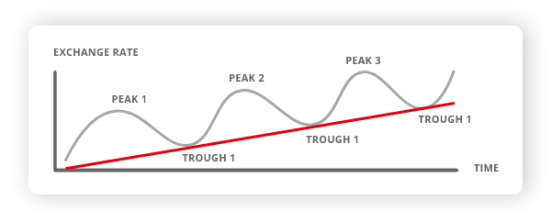
Technical analyst develop trading rules and trading systems by using various theories, charting tools, and indicators. The three principles of Technical Analysis: The market discounts everything, Price moves in trends, History tends to repeat itself.

Technical Analysis

Charting Analysis

  • Bar charts
  • Candle charts
  • Trend lines
  • Channels
  • Levels (S/R)
  • Chart patterns
  • Gaps

Charting Analysis

  • Moving averages
  • Oscillators
  • Envelops/bands
  • Other technical indicators

Charts

Charts help illustrate supply and demand by mapping time on the X-axis and price on the Y-axis.
We have three chart types available on MT4:
Trade using technical analysis line charts.

Line Chart

The most simple of all charts is the line chart. The line chart consists of only a single line which connects consecutive closing prices, without giving us any information about the trading range during the selected time interval.

The Bar Chart

Trade using technical analysis' bullish and bearish charts.
Trade using technical analysis bar charts.
Trade using technical analysis candlestick charts.

The Candlestick Chart

The area between the open and the close is called the real body and price execution above and below the real body are called shadows.
Candlestick charts are virtually superior to bar charts, and thus preferred by traders.

Timeframes

The period represented by a candlestick or a bar can vary from one minute to an hour, to a day, a week or even a month. Analysing more than one timeframes (at least 3 is suggested) allows the trader or the analyst to grasp the multidimensional character of the market.
Although traders opt for shorter timeframes this comes at a trade-off, since longer timeframes contain less “noise” and are thus seen as more reliable.
Trade forex using charts on the EUR/USD pair.

EUR/USD 1-hour Chart

Each candle represents the trading activity within an hour.
Trade using daily charts on the EUR/USD pair.

EUR/USD 1-Daily Chart

Each candle represents the trading activity within a day.
All trading involves risk. It is possible to lose all your capital.

Basic Concepts of Trend

Trend is the direction of the market.
Market moves are characterized by a series of zigzags. These zigzags generate a series of successive peaks and troughs. It is the direction of those peaks and troughs that constitutes a market trend. The concept of trend is very important as many traders rely on the existence of a trend to predict price movements.

A trend can have three directions

  • Upward
  • Downward
  • Sideways

Trend lines can be used to manage trades, identify entry and exit points by focusing on:

  • Trend line breaks and
  • Trend line bounces
Trend lines are used to identify the directional movement of prices, to mark a trend. The slope of the trend can be used in order to grasp the rate of price changes. Their usefulness is based on the principle that once a trend is established, it usually persists for some time.
Trade using technical analysis trend lines.
Trade using technical analysis uptrend lines.

Uptrend

An uptrend is a series of consecutive higher peaks and consecutive higher troughs.
An uptrend line is constructed by connecting two or more higher lows. The line is extended into the future in order to act as a support during the development of the trend. It signals bullish sentiment, i.e. that prices are likely to increase. Traders look to buy the pullbacks near the trend line.
Traders look to buy the pullbacks near the trend line.
All trading involves risk.
It is possible to lose all your capital.
Affiliate World
Global
Dubai, UAE
28 February – 1 March 2022

IronFX Affiliates

iFX EXPO Dubai

22-24 February 2022

Dubai World Trade Center

Meet us there!

Iron Worlds Championship

Grand Finale

Prize Pool!*

*T&Cs apply

iron-world
iron-world

Iron World

November 16 – December 16

Minimum Deposit $5,000

All trading involves risk.
It is possible to lose all your capital.

The Iron Worlds Championship

one-million

Prize Pool!*

planet-usd-thunder
planet-usd-thunder

Titania World

October 15 – November 15

Minimum Deposit $3,000

*T&C apply. All trading involves risk.
It is possible to lose all your capital.

Iron Worlds Championship

one-million

Prize Pool!*

elements-desktop
elements-mobile

Tantalum World

14 September– 14 October

Minimum Deposit $500

*T&C apply. All trading involves risk.
It is possible to lose all your capital.

Thank you for visiting IronFX

This website is not directed at UK residents and falls outside the European and MiFID II regulatory framework, as well as the rules, guidance and protections set out in the UK Financial Conduct Authority Handbook.

Please let us know how would you like to proceed:

Thank you for visiting IronFX

This website is not directed at EU residents and falls outside the European and MiFID II regulatory framework.
Please click below if you wish to continue to IRONFX anyway.

Iron Worlds Championship

one-million

Prize Pool!*

Phosphora World

14 August - 13 September

Minimum Deposit $500

*T&C apply. All trading involves risk.
It is possible to lose all your capital.