

Oil prices seem to have remained in their tight sideways motion since last week. We are to discuss the upcoming tariff deadline from the US and the state of the US oil market once more. The report is to be concluded with a technical analysis of WTI’s daily chart.
Tariff deadline next week
The US’s August 1st tariff deadline is quickly approaching which in turn may lead to heightened volatility in the markets next week.
In particular, attention turns to the EU which has yet to reach an agreement with the US and could potentially face a 30% tariff come next Friday on their exports to the US.
Moreover, the EU has also been preparing for this eventuality with the bloc prepping counter-measures known as the anti-coercion act with the FT stating in a report that a package has already been approved by EU countries which would hit €21bn of annual US imports and a second retaliatory package which would target €72bn of annual US imports which would include Boeing aircraft and bourbon.
Overall, the ‘package’ would take effect on the 7th of August unless a trade deal is agreed by next Friday, which is the 1st of August deadline imposed by the US.
Nonetheless, the FT also stated that the EU and US were closing in on a deal that would impose a 15% tariff on European exports to the US and could be similar in nature to the deal the US struck with Japan earlier on this week.
In our view, one of the main points of friction could be in regards to US autos which face restrictions when being sold in the EU as they are required to conform with EU regulations.
In particular, US Commerce Secretary Lutnick stated in an interview with Bloomberg this week that when asked about the US-EU trade negotiations stated that “If they say that, we will take US cars based on US standards… that’s gonna move the President”, which tends to support our previous argument.
In turn, our opinion is that from a political perspective, the President of the European Commission Ursula von Der Leyen may find it significantly difficult to accept such terms, considering she also survived a vote of no confidence in the European parliament, in which the Green party had supported her.
Nonetheless, we digest, and thus returning to the oil markets, should the US and the EU fail to reach an agreement and result to tit-for-tat tariffs it may raise concerns over the state of the global economy which in turn could weigh on oil prices and vice versa.
US oil market to tighten?
Making a start with the data on the ground of the US oil market, we note that last Friday, Baker Hughes reported once again a reduction of active oil rigs in the US from 424 to 422.
It’s notable that it’s the 12 th weekly drop of the indicator’s reading, potentially signalling once again that demand in the US oil market is easing which in turn may be bearish for oil prices.
However, on Tuesday the API weekly crude oil inventories showcased a reduction in the US oil inventories which may imply that demand exceeded supply and thus could be seen as a positive for oil prices.
Furthermore, the EIA weekly crude oil inventories figure showcased a wider drawdown than what was expected at -3.169 million barrels versus -1.400 million barrels.
In turn should the API and EIA inventories figure continue to showcase an increase in demand for oil in the upcoming week as
well, it could potentially aid oil prices.
Oil Technical Analysis
WTI Cash Daily Chart
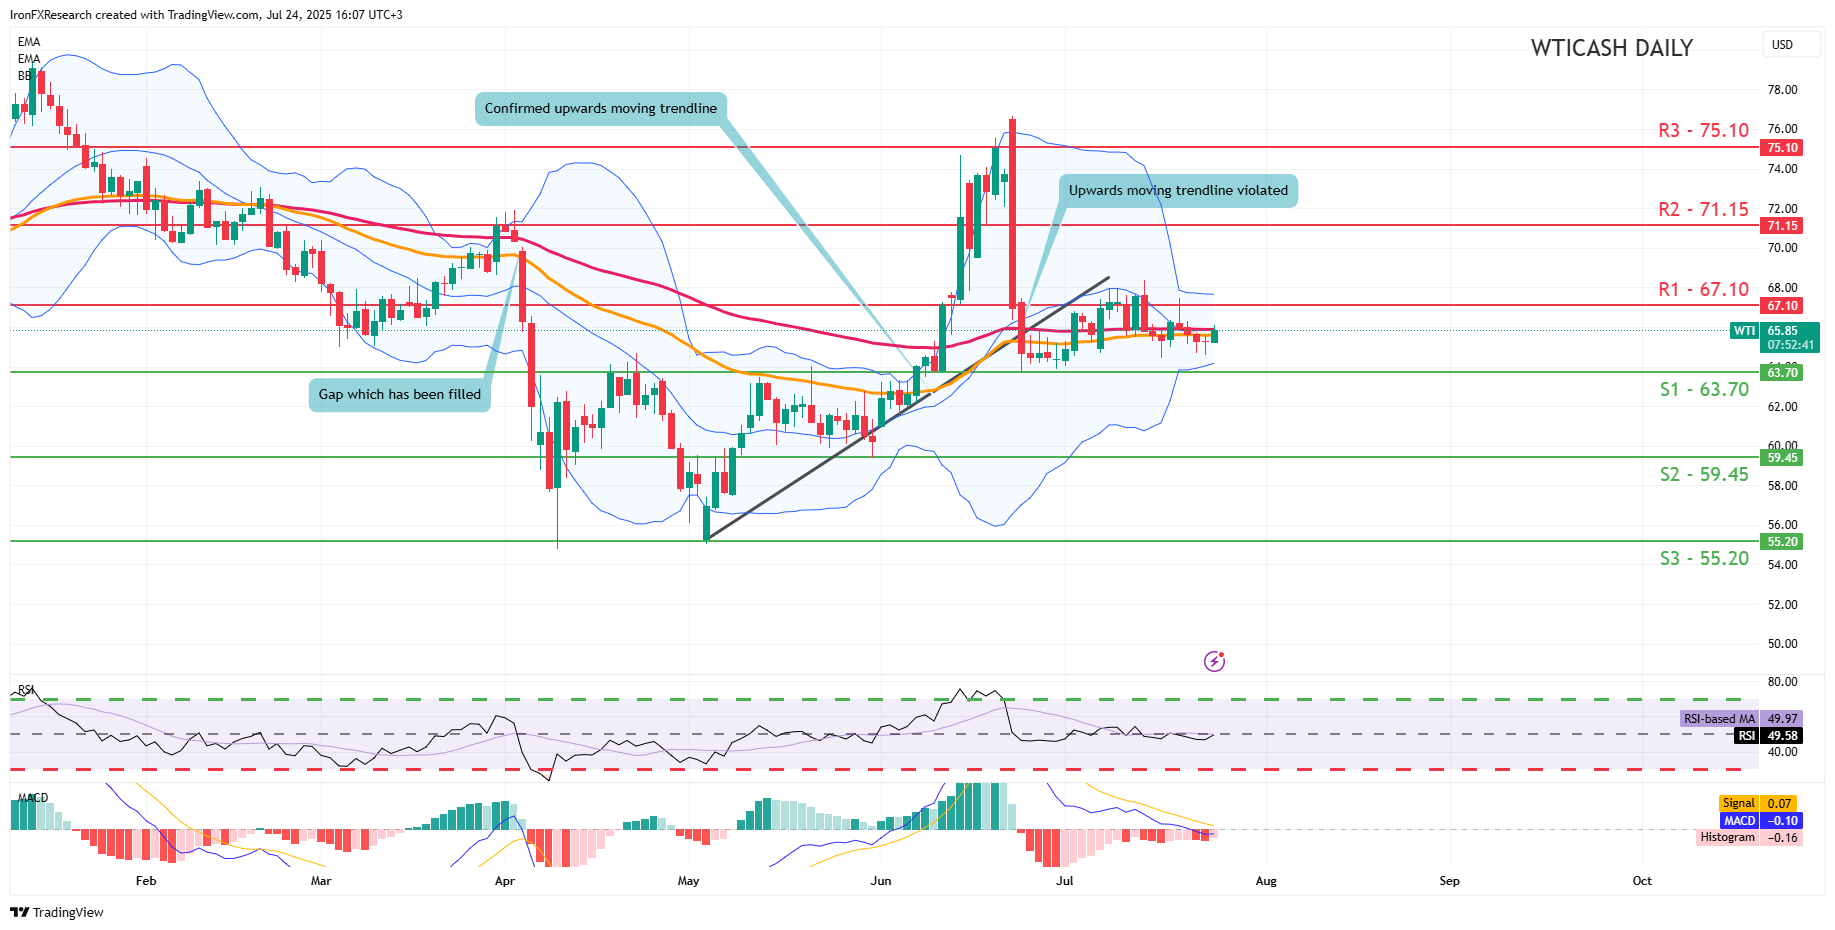
- Support: 63.70 (S1), 59.45 (S2), 55.20 (S3)
- Resistance: 67.10 (R1), 71.15 (R2), 75.10 (R3)
WTI’s price appears to be moving in a tight sideways fashion for the time being between our 63.70 (S1) support level and our 67.10 (R1) resistance line.
We cautiously opt for a sideways bias for the commodity’s price and supporting our case is the RSI indicator below our chart which currently registers a figure near 50, implying a neutral market sentiment.
Yet the MACD indicator continues to showcase bearish market tendencies.
Nonetheless, for our sideways bias to be maintained we would require the commodity’s price to remain confined between the 63.70 (S1) support level and our 67.10 (R1) resistance line.
On the other hand, for a bearish outlook we would require a clear break below our 63.70 (S1) support line with the next possible target for the bears being the 59.45 (S2) support level.
Lastly, for a bullish outlook we would require a clear break above our 67.10 (R1) support level with the next possible target for the bulls being the 71.15 (R2) resistance line.
Disclaimer:
This information is not considered investment advice or an investment recommendation, but instead a marketing communication. IronFX is not responsible for any data or information provided by third parties referenced or hyperlinked in this communication.


