
Oil prices have moved decisively lower since our last report, highlighting the market’s bearish tendencies. Today we are to take a look at the new US administration’s energy policies and their possible impact on the oil market. For a rounder view, we are to conclude the report with a technical analysis of WTI’s daily chart.
The Trump energy era
On Monday the 20th of January, Trump was inaugurated as the 47th President of the United States of America. The new administration wasted no time, with the President during his inauguration speech, re-iterating his motto of “drill baby drill”, in addition to refilling the Strategic Petroleum Reserve.
The Trump administration appears poised to open the oil tap, with ‘The Hill’ reporting that Trump signed an executive order that seeks to rescind a recent order that was intended to block 625 million acres offshore from oil and gas drilling. In addition, Trump is seeking to revoke another order that had blocked 2.8 million acres in the Arctic Ocean from oil and gas drilling.
Overall, it appears that the campaign slogan of “drill baby drill” may be becoming a reality and thus, the implications of an increase in oil supply over the long run, which in turn may exceed demand, appears to have weighed on oil prices. In our view, we would not be surprised to see measures by the Trump administration in order to facilitate an increase in US oil production, which could facilitate an increase in production which in turn could weigh on oil prices.
Oil Technical Analysis
WTI Cash Daily Chart
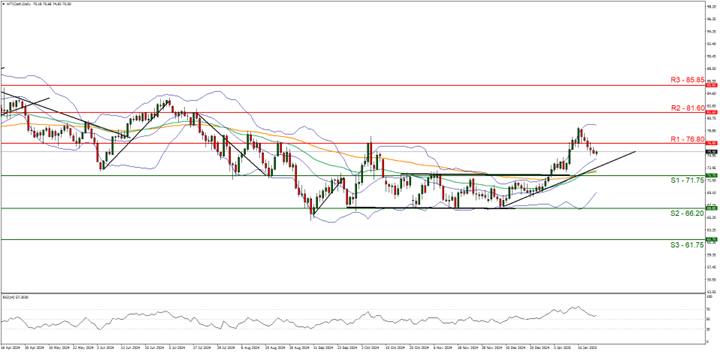
- Support: 71.75 (S1), 66.20 (S2), 61.75 (S3)
- Resistance: 76.80 (R1), 81.60 (R2), 85.85 (R3)
WTICash appears to in a predominantly sideways fashion, with the commodity having broken below our support now turned to resistance line at the seventy one point seventy five level. Moreover, we would like to note the RSI indicator below our chart which currently registers a figure near 50, implying a neutral market sentiment and the steep decline from the reading near 70, could also imply that the bullish momentum may have dissipated.
On the flip side, we would like to note that the upwards-moving trendline which was incepted on the 9th of December remains intact and a golden cross appears to have been formed, with the 50 moving average line crossing above the 100 moving average line, which tends to imply bullish tendencies in the market in the long run. Nonetheless, for our sideways bias to be maintained we would require the commodity’s price to remain confined between the seventy one point seventy five support level and the seventy six point eighty resistance line.
On the other hand, for a bearish outlook, we would require a break below the seventy one point seventy five support level, with the next possible target for the bears being the sixty six point twenty support base. Lastly, for a bullish outlook, we would require a clear break above the seventy six point eighty resistance line with the next possible target for the bulls being the eighty one point sixty resistance ceiling.
Disclaimer:
This information is not considered investment advice or an investment recommendation, but instead a marketing communication. IronFX is not responsible for any data or information provided by third parties referenced or hyperlinked in this communication.


