
Oil prices have moved higher since last report, in a sign that the oil bulls are now in full control of the liquid gold’s price. In today’s report, we are to have a look at the data relating to the US oil market and continue to view the fundamentals surrounding the international oil market. To conclude the report we will also provide a technical analysis of WTI’s daily chart.
The uptick in the US oil market could support oil prices
Making a start with the US oil market data, we note that on Friday, Baker Hughes announced another reduction of active oil rigs in the US reaching now 479, down from the prior report of 485.
It should be noted that it’s the fifth consecutive drop of the number of active oil rigs in the US, implying an easing of oil demand which could weigh on oil prices. However, on Tuesday the API reported a much greater drawdown of US oil inventories of -9.163 million barrels, which is significantly lower than last week’s increase of 0.914 million barrels.
Furthermore, the EIA crude oil inventories figure also showcased a significant reduction in oil inventories, with the figure coming in at -12.157 million barrels versus the expected figure of -0.400 million. Both financial releases tend to imply that demand in the US oil market has increased significantly last week, which in turn could support oil prices.
Overall, with the summer period now in full swing, we would not be surprised to see an uptick in demand for oil up until the end of the summer months. As such, should the API and EIA crude oil inventories figures continue to showcase an uptick in demand for oil, it could further supportoil prices in the coming week
The situation in the Middle East continues to escalate
We highlight our continued concern for the hostilities between Israel and Hezbollah. It should be noted that Israel killed a senior commander during an air strike in southern Lebanon, making him the latest senior member of Hezbollah to be targeted by Israel.
As a result of the strike, Hezbollah retaliated by launching 100 rockets and missiles towards Israeli positions, according to Reuters. The situation appears to be escalating, with Israeli Defence Minister Gallant stating on Wednesday according to the BBC that “We are striking Hezbollah very hard every day and we will also reach a state of full readiness to take any action required in Lebanon, or to reach an arrangement from a position of strength”.
Therefore, should the tensions between the two continue to escalate, we would not be surprised to see a small-scale incursion from Israeli forces into the southern region of Lebanon. Such a scenario could evolve very quickly and intensely.
Should there be a full-blown war between Hezbollah and Israel, the risk of escalating to a regional conflict with the participation of other forces rises as well, which in turn could have substantial bullish effects on oil prices.
Saudi Arabia announces discovery of seven oil and gas deposits in the kingdom
According to a report by Reuters, Saudi Arabia’s energy minister announced on Monday the discovery of seven oil and gas deposits in the kingdom’s Eastern Province and Empty Quarter. The possibility of an increase in the oil supply could potentially weigh on the liquid gold’s price.
However, we stress that any impact may not be seen immediately and may take a significant amount of time, as the impact on oil prices may depend on a number of factors. Nonetheless, the discovery could have implications for oil prices in the long run, yet any impact on oil prices has yet to be seen.
Manufacturing data from China and the US
In China the Caixinmanufacturing PMI figure came in higher than expected at 51.8 versus the expected figure of 51.5, implying an expansion in the manufacturing sector of the Chinese economy. The release could imply that demand for oil from China may increase, which in turn may have a bullish effect on oil prices.
However, it should be noted that the NBS figure remained steady at 49.5, which still implies a contraction in the Chinesemanufacturingsector, which in turn may cast some doubt on the aforementioned scenario.
Over in the US the ISM and S&PmanufacturingPMIfigures for June came in lower than expected, with the ISM PMI figure showcasing a wider contraction of economic activity for the US manufacturing sector. The financial releases could have a bearish effect on oil prices from a more macro perspective as it may imply lower US oil demand in the future.
Technical Analysis
WTI Cash Daily Chart
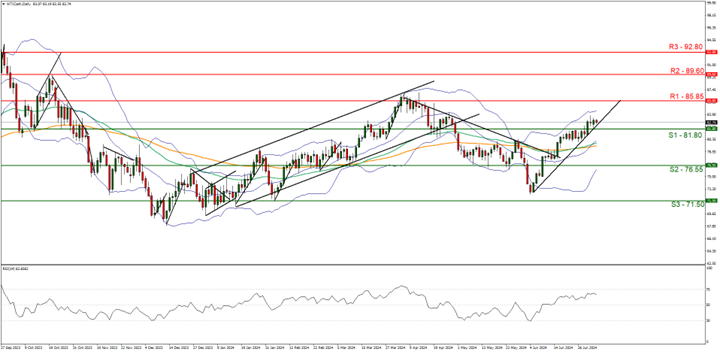
- Support: 80.25 (S1), 76.70 (S2), 71.85 (S3)
- Resistance: 85.85 (R1), 89.60 (R2), 92.80 (R3)
WTI appears to be moving in an upwards fashion, having broken above our resistance now turned to support level at the 81.80 (S1) figure.
We maintain a bullish outlook for the commodity and supporting our case is the RSI indicator below our chart which currently registers a figure above 60, implying a bullish market sentiment. Further, aiding our case is the upwards-moving trendline which was incepted on the 5th of June, which has remained intact.
For our bullish outlook to continue we would require a break above the 85.85 (R1) resistance level, with the next possible target for the bulls being the 89.60 (R2) resistance line. On the flip side for a sideways bias, we would require the commodity to remain confined between the 81.80 (S1) support line and the 85.85 (R1) resistance line.
Lastly, for a bearish outlook we would require a clear break below the 81.80 (S1) support level with the next possible target for the bears being the 76.55 (S2) support line.
Disclaimer:
This information is not considered investment advice or an investment recommendation, but instead a marketing communication. IronFX is not responsible for any data or information provided by third parties referenced or hyperlinked, in this communication.


