

Oil prices seem to have stabilised somewhat since our last report and in today’s report we are to look mainly at fundamental issues affecting wti prices. We are to discuss the easing of the US oil market, US President Trump’s intentions to apply tariffs but also OPEC+’s oil production intentions. The report is to be concluded with a technical analysis of WTI’s daily chart.
Easing of US oil market widens
Making a start with the data on the ground of the US wti market, we note that last Thursday, Baker Hughes reported a reduction of active oil rigs in the US by seven. It’s notable that it’s the 10th weekly drop of the indicator’s reading, in a signal that demand in the US wti market is easing and tends to be a bearish sign for wti prices.
Furthermore on Tuesday API, despite expected to show a drawdown, showed a wide build up of US wti inventories by 7.1 million barrels underscoring of the slack in the US wti market. Also EIA yesterday, unexpectedly reported an increase of US oil inventories, by 7.010 million barrels, highlighting that aggregated oil production levels surpassed oil demand levels, given that wti imports in the US were reduced by 1.358 million barrels.
All data tend to highlight the easing of the US wti market, yet we also note that the widening of the easing of the US oil market seems to have intensified which in turn may keep oil bulls in check or even weigh on oil prices.
Trump’s trade wars and oil demand
On a deeper fundamental level, oil traders seem to be less concerned with US President Trump’s tariff intentions than we may have been expecting, yet the issue may continue to threaten the stability of the international oil market. Our interest lies mostly not in the letters already sent out, which have been publicized, but on the tariff letters that are still to be released including Taiwan, India and the EU which have a heavy trading volume with the US.
Overall we see the case for tariffs to lower trade volume, in turn easing manufacturing activity and consequently may entail an adverse effect for wti demand. It should be noted that China’s manufacturing PMI figures provided mixed signals for June, in a sign of Chinese factories struggling to keep economic activity afloat, while in the US the ISM manufacturing PMI figure for June, despite rising remained below 50, implying that economic activity in the US manufacturing sector is still in contractionary mode. Overall intensification of frictions in international trade relationships could weigh on oil prices and vice versa.
OPEC’s production levels
There is a heavy discussion in the international oil market about OPEC+’s production levels. It should be noted that the wti producing alliance, more or less altered its stance over the past months hiking oil production levels albeit somewhat cautiously one could add. It should be noted that according to the latest data, wti production by OPEC members increased in June with the main drivers behind the increase of wti production being Saudi Arabia and UAE.
Efforts of OPEC seem to be focusing in regaining lost market share and should OPEC’s intentions for an increase of oil production be maintained we may see it weighing on oil prices. Yet there seems to be increasing buzz among oil traders that OPEC members ahead of their online meeting on Saturday, are discussing a pause of the increase of oil production levels from October onwards.
We also note that OPEC in its latest outlook lowered forecasts for the global oil demand which may add pressure to halt any oil production hikes. Should we see market expectations for OPEC pausing oil production hikes intensifying, we may see oil prices getting additional support as the supply side of the international oil market may tighten.
Oil Technical Analysis
WTI Cash Daily Chart
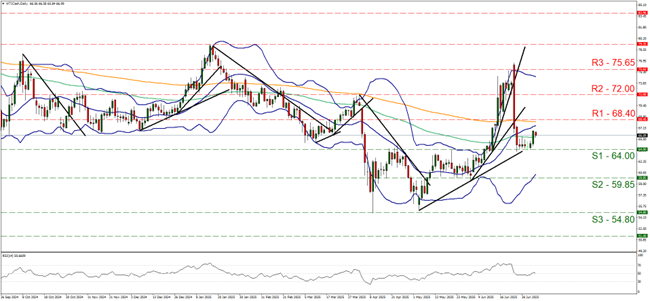
- Support: 64.00 (S1), 59.85 (S2), 54.80 (S3)
- Resistance: 68.40 (R1), 72.00 (R2), 75.65 (R3)
WTI’s price tended to stabilise after rising on Monday, yet remained well within the boundaries set by the 68.40 (R1) resistance line and the 64.00 (S1) support level.
Overall we see the case for the sideways motion between the prementioned levels to be maintain for now and note that the RSI indicator remains flat just above the reading of 50, implying a relative indecisiveness on behalf of market participants for the direction of the commodity’s price action.
Also the 100 and 200 moving averages seem to have flattened out and the Bollinger Bands seem to be narrowing, also suggesting a possible sideways motion. Should the bulls take over, we may see WTI’s price action breaking the 68.40 (R1) resistance line and continue higher by aiming for the 72.00 (R2) resistance base.
Should the bears take over, we may see the commodity’s price dropping, breaking the 64.00 (S1) support line and start aiming for the 59.85 (S2) support level
Disclaimer:
This information is not considered investment advice or an investment recommendation, but instead a marketing communication. IronFX is not responsible for any data or information provided by third parties referenced or hyperlinked in this communication.


