

Since last week’s report, oil prices seem to have continued on their sharp decent. In the current report we are to discuss the conditions characterising the US oil market currently, as well as factors affecting oil demand and supply in the international oil market. We are to complete the fundamentals included in the report with a technical analysis of WTI’s chart.
Mixed signals from the US oil market
We make a start by noting that some aspects of the US oil market show signs of tightening. Starting with the Baker Hughes wti rig count last Friday which showcased an increase in the number of active oil rigs in the US, which tends to be a positive sign for oil prices. Specifically, it showcased an increase in wti rig count by two implying that demand for oil may be increasing.
Moreover, it’s characteristic that the EIA reported an unexpected contraction of US oil inventories by –2.696 million barrels. Yet the API weekly crude oil inventories figure showcased a significant increase in US wti inventories by 3.760 million barrels.
The contradicting reports by the two oil agencies tend to fail to paint a clear picture in the wti market, which could lead to heightened volatility in the market.
Nonetheless, should both agency’s showcase a drawdown in oil inventories in the coming week, thus imply that demand may be exceeding supply it could in turn aid oil prices. On the flip side, should the showcase an increase in inventories it may have the opposite effect and could thus weigh on oil prices.
Saudi appears unfazed from the lower oil prices
Reuters reported earlier on this week that Saudi Arabian officials have been briefing allies and industry experts that the Kingdom is unwilling to prop up the wti market with supply cuts. This may infer that the Kingdom is willing to “live” with a period of prolonged low oil prices.
Moreover, OPEC could potentially increase the supply of wti into the market given the already low prices to increase their market share. Nonetheless, the possibility of the Kingdom’s willingness to keep wti prices lower may weigh on the commodity’s price as it could also imply that OPEC the wti cartel may not attempt to artificially increase prices in the near future.
In conclusion should further information emerge that Saudi Arabia and OPEC+ is willing to keep wti prices at their currently levels or even possibly increase wti production in the near future, it may weigh on oil prices further. However, should doubt be cast on our aforementioned scenario it may have the opposite effect which in turn could aid oil prices.
Oil Technical Analysis
WTI Cash Daily Chart
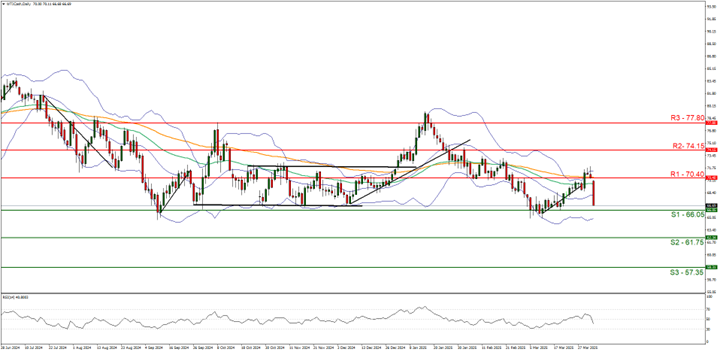
- Support: 66.05 (S1), 61.75 (S2), 57.35 (S3)
- Resistance: 70.40 (R1), 74.15 (R2), 77.80 (R3)
WTI’s appears to be moving in a downwards fashion with the commodity currently appearing to be aiming for our 66.05 (S1) support level.
We opt for a bearish outlook for the commodity’s price and supporting our case is the RSI indicator below our chart which currently registers a figure of 40 implying a bearish market sentiment. For our bearish outlook to continue we would require a clear break below the 66.05 (S1) support level, with the next possible target for the bears being the 61.75 (S2) support line.
On the flip side, for a sideways bias we would require the pair to remain confined between the 66.05 (S1) support line and the 70.40 (R1) resistance line. Lastly, for a bullish outlook we would require a clear break above the 70.40 (R1) resistance level, with the next possible target for the bulls being the 74.15 (R2) resistance line.
Disclaimer:
This information is not considered investment advice or an investment recommendation, but instead a marketing communication. IronFX is not responsible for any data or information provided by third parties referenced or hyperlinked in this communication.


