
Since our last report ,oil prices stopped their four-week descent with the commodity set to end the week in the greens. Today we are to take a look at the state of the US oil market as well as other fundamental issues affecting the demand and the supply side of the international market. For a rounder view, we are to conclude the report with a technical analysis of WTI’s daily chart.
Mixed signals in the US oil market
We make a start with the situation of the US oil market. On Friday, the release of the US Baker Hughes total rig count, showed that the number of active oil rigs continues to increase, by rising to 481 from 480.
The release tended to imply once again, a continuation of bullish signals for oil prices as it may imply that demand continues to be on the rise which may force oil producers to continue activating oil rigs. Yet for another week in a row, the idea of a tightening US oil market continues to be contradicted, with the API weekly crude oil inventories figure showcasing an increase of 3.339 million barrels, a figure lower than last week’s figure of 9.043 million barrels, yet higher than the expected figure of 2.2 million barrels.
The release highlighted how aggregated oil production surpassed oil demand levels, implying a slack in demand from the US oil market over the past week. In turn this may have weighed on oil prices, yet that does not appear to be the case.
G7 to redraw Russian Oil Price Cap?
According to a report by Bloomberg, the G7 is considering collectively tightening an oil price cap on Russian petroleum. The report stated that the draft shows that G-7 nations could task their finance ministers to collectively redraw the price limit which is currently set at $60 per barrel.
The redrawing appears to be an attempt to influence the “peace” talks in regards to Ukraine, in order to gain influence on Russia. Nonetheless, the possibility of a higher price cap on Russian oil, could potentially aid Crude oil prices in the short term. Lastly, the article by Bloomberg implies that the statement may be released on the 24th of February which would mark the 3-year anniversary of Russia’s invasion of Ukraine.
On the flip side, should the alleged draft not be released with its current implications as stated by Bloomberg on the 24th of February, then it could instead weigh on oil prices.
Oil Technical Analysis
WTI Cash Daily Chart
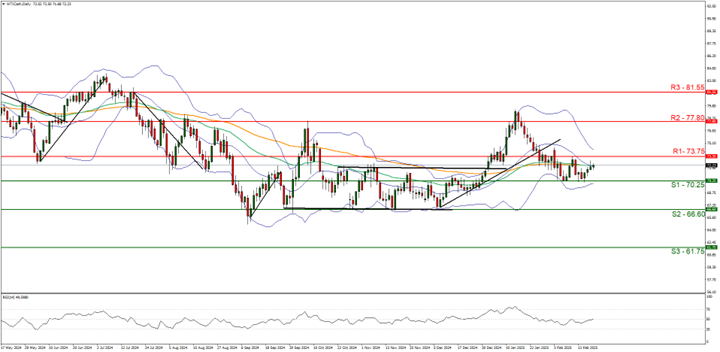
- Support: 70.25 (S1), 66.20 (S2), 61.75 (S3)
- Resistance: 73.75 (R1), 77.80 (R2), 81.55 (R3)
WTI appears to have halted its four-week descent. We opt for a neutral outlook for the commodity’s price and supporting our case is the RSI indicator below our chart which currently registers a figure near 50, implying a neutral market sentiment. For our sideways bias to continue, we would require the commodity’s price to remain confined between the 70.25 (S1) support level and the 73.75 (R1) resistance line.
On the other hand for a bearish outlook we would require a clear break below the 70.25 (S1) support level with the next possible target for the bears being the 66.60 (S2) support line. Lastly, for a bullish outlook we would require a clear break above the 73.75 (R1) resistance line with the next possible target for the bulls being the 77.80 (R2) resistance level.
Disclaimer:
This information is not considered investment advice or an investment recommendation, but instead a marketing communication. IronFX is not responsible for any data or information provided by third parties referenced or hyperlinked in this communication.


