

Gold’s price has been declining for the past three trading days and was still under selling pressure in today’s Asian session.
In today’s report, we are to discuss the market’s expectations for the Fed’s intentions, the validity of the negative correlation of the USD with gold at the current stage and upcoming financial releases that could shake the precious metal’s price.
For a rounder view, we are to provide a technical analysis of gold’s daily chart.
The market now prices in the Fed to remain on hold in December
Since our last report, the main driver behind gold’s movement on a fundamental level may have been the market’s expectations for the Fed’s intentions.
It should be noted that two weeks ago, the market was pricing in a possible rate cut in the December meeting by 70%, yet last Friday, the possibility of a rate cut was equal to the chances of the bank remaining on hold.
Today Fed Fund Futures imply a probability of 57.9% for the bank to keep rates unchanged and the rest implying that a 25 basis points rate cut is still possible. Signals from Fed policymakers were mixed over the past few days.
It’s characteristic that Dallas Fed President Logan and Kansas Fed President Schmid suggested that the bank should remain on hold, while Atlanta Fed President Bostic sounded uncertain about a rate cut in the December meeting, while Fed Board Governor Waller stated that he will be backing a rate cut. In the grand scheme of things, it seems that there is a shift among centrist Fed policymakers towards the bank remaining on hold in the coming meeting, which in turn forced the market to readjust its expectations.
We highlight the release of the Fed’s October meeting minutes tomorrow, and should the document intensify the market’s expectations for the Fed to remain on hold in the December meeting, we may see the release weighing on gold’s price and vice versa. Also, we expect statements by Fed policymakers to continue swaying the market’s expectations.
The negative correlation of the USD with gold remains inactive
Another issue that tends to be under gold traders’ magnifying glass is the validity of the negative correlation between the USD and gold’s price at the current stage.
We note that the USD index maintained very subtle movements signalling a relative stability of the USD against other currencies in the FX market over the past week.
On the other hand, the movement of gold’s price was quite intense since last Tuesday, and despite the two trading instruments at some points taking opposite directions, the lack of high volatility on behalf of the USD tends to blur the relationship between the two trading instruments.
Hence, we tend to view the negative correlation of the two trading instruments as currently being.
Furthermore, we note that US bond yields, despite some ups and downs, remained at relatively low levels and that applies both for shorter-term as well as longer-term bonds.
Hence, the possibility of US bonds presenting a lucrative alternative to the non-interest-bearing shiny metal remains, in our opinion, at low levels currently.
October’s US employment data could shake gold’s price
Yet there is another release that could alter the markets’ expectations for the Fed’s intentions and, in this way, shake gold’s price.
With the US Government shutdown being lifted, the market now braces for the release of high-impact data.
Next in line is the release of October’s US employment data on Thursday.
Should the US employment data for October, show that the US employment market has eased considerably or even possibly cratered in the past month we may see the pressure on the Fed to continue easing its monetary policy and thus could provide support for gold’s price, while should the data show a tighter than expected US employment market in the past month, we may see the release weighing on gold’s price.
Gold Technical Analysis
XAU/USD Daily Chart
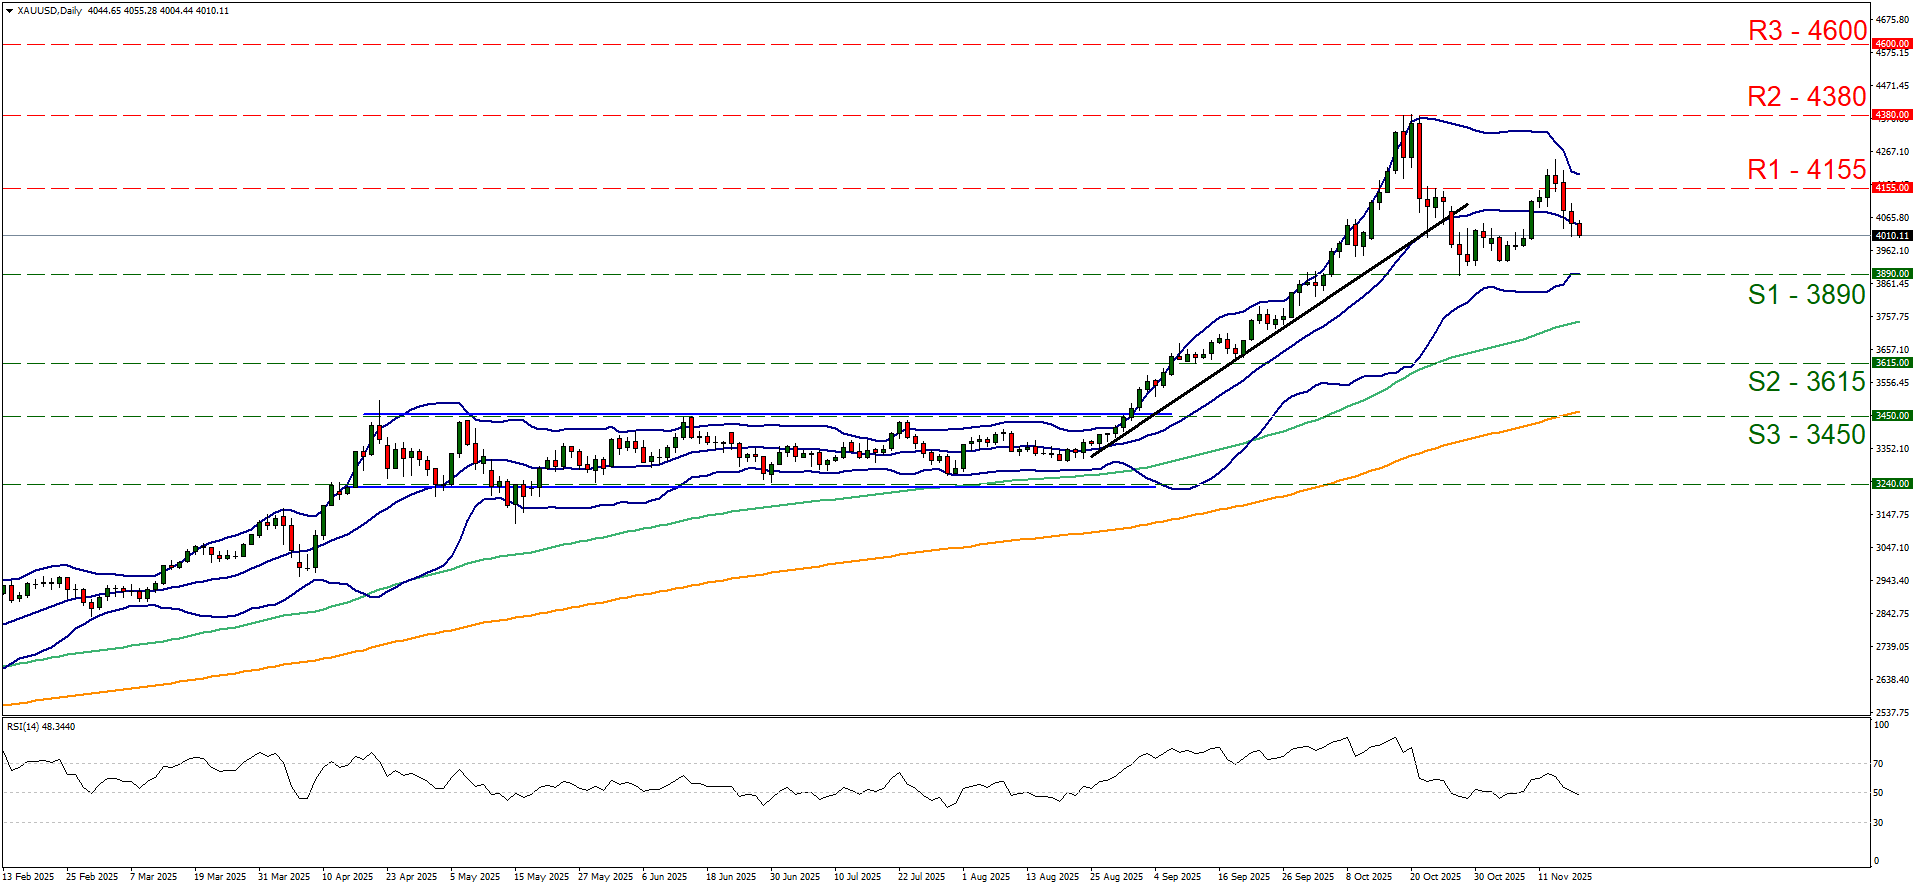
- Support: 3980 (S1), 3615 (S2), 3450 (S3)
- Resistance: 4155 (R1), 4380 (R2), 4600 (R3)
XAU/USD continued to retreat in today’s Asian session after a three-day losing streak and is currently aiming for the 3980 (S1) support line. Despite the bearish tendencies of gold’s price, we tend to maintain a bias for a sideways motion of the precious metal’s price.
We note that the RSI indicator dropped, reaching the reading of 50, implying an erasing of the bullish market sentiment for gold’s price, yet still has not implied the existence of a bearish market sentiment for gold’s price among market participants, at least not yet.
Also, we note the convergence of the Bollinger bands, implying less volatility for gold’s price, which in turn could allow gold’s price to stabilise.
For a bearish outlook to be adopted, we would require gold’s price to break below the 3980 (S1) support line marking the latest trough of gold’s price action, thus allowing for a downward trendline to be formed as we will have a lower peak and a lower trough.
Should the S1 be clearly broken, then the gates would be open to push gold’s price towards the 3615 (S2) support base.
On the flip side, for a bullish outlook to emerge, we would require gold’s price to break the 4155 (R1) resistance line and start actively aiming if not reaching the 4380 (R2) resistance level, in which case we would have higher peaks and higher troughs, allowing us to draw an upward trendline showing the limitations of a possible upward movement.
Disclaimer:
This information is not considered investment advice or an investment recommendation, but instead a marketing communication. IronFX is not responsible for any data or information provided by third parties referenced or hyperlinked in this communication.


