

Gold’s price has moved lower since the beginning of the week, Gold bulls appear to still be in the driver’s seat with Israel, Iran and the US still battling it out.
In today’s report we are to have a look at the market uncertainty over the developments in the Middle East as well as the upcoming release of the US PCE rates . For a rounder view we intend to conclude the report with a technical analysis of gold’s daily chart.
Israel-Iran ceasefire violated within hours
Since our last report, the tensions in the Middle East have escalated significantly with Israel and Iran having entered a war which resulted in the US deciding to directly strike Iran and Iran to retaliate by striking a US based in Qatar.
Following those developments, market participants were worried that the conflict would continue and that a possible regime change in Iraq was in sight, a possibility which could had further intensified market worries about a wider war occurring.
Yet, President Trump attempted to broker a deal with Israel and Iran which was signed today. In turn following the announcement of the peace deal, concerns over a prolonged war may have diminished which may have weighed on gold’s price.
However, hours after signing the so-called ceasefire deal, Israel alleges that Iran has fired missiles towards a territory, thus violating the ceasefire, a claim which the Iranian’s have so for denied. As a result Israel has conducted a retaliatory strike.
Overall, the situation is extremely volatile and should Israel and Iran continue to exchange blows it may aid gold’s price given its safe haven asset status. On the other hand, should no further escalations occur, it may weigh on gold’s price.
US PCE rates
The US PCE rates for May are set to be released this Friday and may garner significant attention from market participants. The US PCE rates are the Fed’s favourite tool for measuring inflationary pressures in the US economy, thus should they showcase an acceleration of inflationary pressures, it may increase pressure on the Fed to refrain from cutting rates in the near future.
Thus such a scenario could aid the dollar whilst weighing on gold’s price given their inverse relationship. On the other hand, should the Core PCE rates showcase easing inflationary pressures it may instead increase pressure on the Fed to cut rates in the near future which could weigh on the dollar whilst aiding gold’s price.
Gold Technical Analysis
XAUUSD 4H Chart
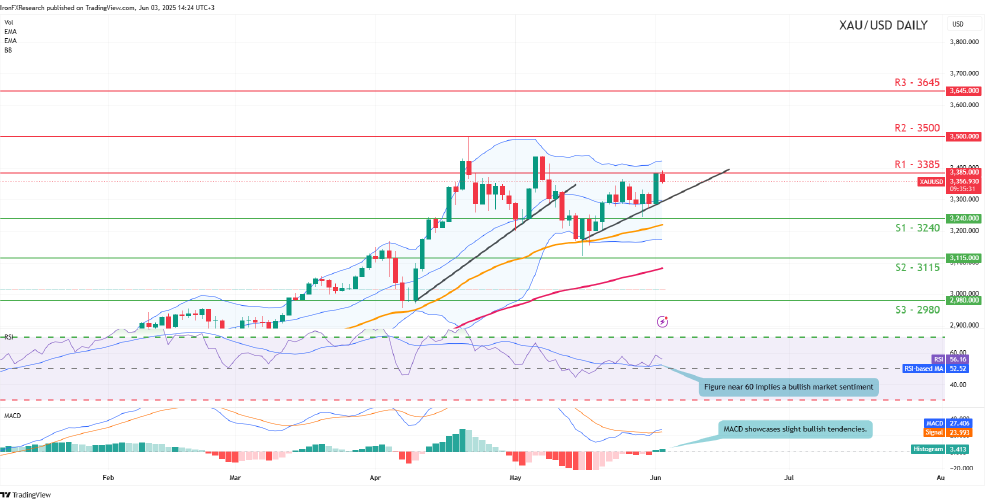
- Support: 3240 (S1), 3115 (S2), 2980 (S3)
- Resistance: 3385 (R1), 3500 (R2), 3645 (R3)
XAU/USD appears to be moving in a downwards fashion, with gold’s price appearing to be aiming for our 3240 (S1) support level. We opt for a bearish outlook for gold’s price, yet the RSI indicator still currently registers a figure near 50 which may imply a neutral market sentiment.
For our bearish outlook to continue we would require a clear break below our 3240 (S1) support level with the next possible target for the bears being the 3115 (S2) support line.
On the other hand for a sideways bias we would require gold’s price to remain confined between the 3240 (S1) support level and the 3385 (R1) resistance line. Lastly, for a bullish outlook we would require a clear break above the 3385 (R1) resistance level with the next possible target for the bulls being the 3500 (R2) resistance line.
Disclaimer:
This information is not considered investment advice or an investment recommendation, but instead a marketing communication. IronFX is not responsible for any data or information provided by third parties referenced or hyperlinked in this communication.
