
Gold’s price has maintained its bullish tendencies since our last report, with the precious now maintaining its three-week winning streak. The upward motion had a strong monetary policy background, and we tend to note that there is still volatility ahead for the precious metal in the current week. Today we are to discuss the fundamental challenges laid ahead for the precious metal, while we will be concluding this report with a technical analysis of gold’s daily chart.
Gold Market Report
US Employment data
We anticipate the high levels of volatility in the gold market to remain elevated for the rest of the week. In particular, the release of the US employment data for December later this week could further intensify the negative correlation of gold’s price with the US dollar.
In particular, we should note that the unemployment rate is expected by economists to increase from 3.7% to 3.8%; in addition, the non-farm payrolls figure is expected to decrease from 199k to 163k, with both releases expected to showcase a loosening labor market. The implications of the validation of the aforementioned opinion could further support the market’s current expectations of six rate cuts by the Fed this year, as the need to maintain its relative hawkishness could be weakened further. As such, we could see the dollar weakening, and as a result, the release could create bullish tendencies for gold’s price.
Whereas the indicators should imply that the US labor market remains relatively tight, we could see renewed concerns about the Fed maintaining the current interest rate levels for a longer period, which could support the dollar and thus potentially weaken the precious metal given their inverse relationship. Furthermore, in regards to the Fed’s intentions, we highlight the release of the Fed’s December meeting minutes on Wednesday, and should there be doubts about extensive rate cuts among policymakers, we may see gold’s price losing ground.
US Manufacturing PMIs.
The US manufacturing PMI figures for December are due to be released this week. In particular, the S&P Manufacturing PMI figure is due to be released later today, whereas the ISM Manufacturing PMI is due to be released on Wednesday, during the American session. It appears that there is a discrepancy between the two releases, with the S&P figure expected to showcase a widening contraction in manufacturing activity, whereas the ISM figure is projected to imply a slight narrowing of the contraction.
Nonetheless, we shall explore both scenarios and what their repercussions could be. Firstly, should the manufacturing PMI figures indicate a further contraction in activity, it could weigh on the dollar, as concerns about a potential recession in the US economy may resurface and thus could lead to gold gains given their inverse relationship. On the other hand, should they show an improvement by coming in better than expected, it could provide support for the greenback, as the manufacturing backbone of the US may be more resilient than what was previously expected, and as such, gold could weaken.
Saudi Arabia discovers new gold reserves
According to Reuters, Saudi Arabian mining company Maaden announced last Thursday that it had discovered multiple gold deposits south of its existing Mansourah Massarah gold mine. The announcement comes following the company’s exploration program that was launched in 2022, which aimed to search a 100-km strip. Moreover, according to the company, the samples taken from the site imply that there is a high grade of gold deposits in the area, following the testing of the samples taken from two random drilling sites.
On a more macro level, should the anticipated high density of deposits in the area materialize, we could see an influx of gold into the market, which could, in theory, decrease the price of gold as supply becomes more available. However, given that the procedures to drill and extract gold are costly and take a significant amount of time, it may not impact the price of the precious metal, yet it’s still worth keeping an eye on future developments.
Gold: Technical Analysis
XAUUSD Daily Chart
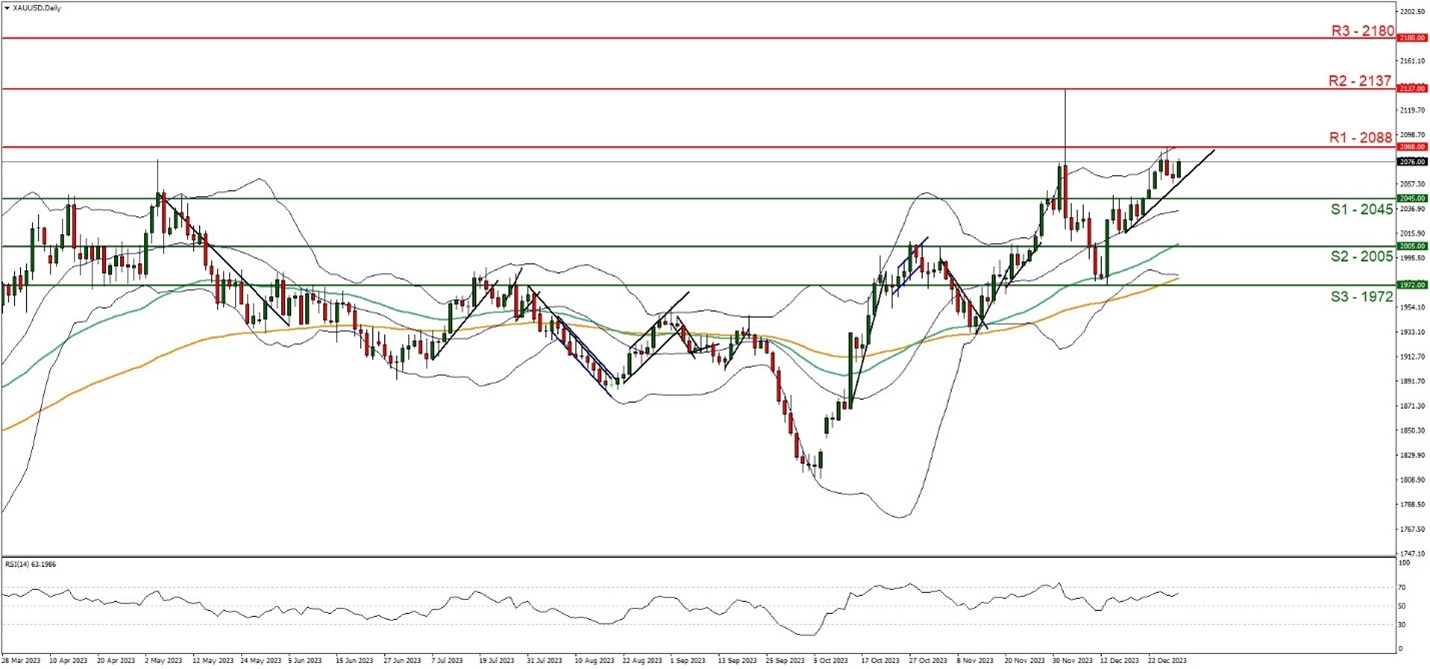
- Support: 2045 (S1), 2005 (S2), 1972 (S3)
- Resistance: 2088 (R1), 2137 (R2), 2180 (R3)
On a technical level, we note that Gold appears to be continuing its 3-week winning streak, with the precious metal having broken above the resistance line, now turned to support, at the 2045 (S1) level, and having tested resistance at the 2088 (R1) base before stabilizing somewhat. It should be noted that the RSI indicator below our daily chart currently remains above the figure of 60, implying that some bullish tendencies remain in the market.
Overall, the data tends to imply a possible upward motion, with the upwards-moving trendline which was incepted on the 18th of December, remaining intact, implying a bullish market sentiment, in addition to the Bollinger band median, which appears to be tilted to the upside, implying a bullish market sentiment as also do the 50 and 100 moving averages. We maintain a bullish bias for gold’s price action.
For our bullish bias to continue, we would like to see a clear break above the 2088 (R1) resistance level, with the next potential target for the bulls being the 2137 (R2) resistance ceiling. Whereas, for a sideways bias to occur, we would like to see the precious metal remain confined between the 2045 (S1) support level and the 2088 (R1) resistance ceiling. Lastly, for a bearish outlook, we would like to see a clear break below the 2045 (S1) support level, with the next possible target for the bears being the 2005 (S2) support base.
Disclaimer:
This information is not considered investment advice or an investment recommendation, but instead a marketing communication. IronFX is not responsible for any data or information provided by third parties referenced or hyperlinked, in this communication.


