
Despite some ups and down the upward trajectory of oil prices was clearly maintained with WTI reaching levels not seen since the early days of November last year. In this report, we aim to shed light on the factors driving WTI’s price, assess its future outlook and conclude with a technical analysis.
The US oil market
We make a start with the latest data concerning the US oil market. As last week draw to a close, Baker Hughes reported that the number of active oil rigs dropped by four, reaching 525, a level not seen since March last year. The drop is not to be considered a positive signal for oil prices as it would imply lesser demand in the US oil market. Yet the negative news kept coming in as the American Petroleum Institute (API) reported an increase in US oil inventories on Tuesday. Similarly, the Energy Information Administration’s (EIA) Crude Oil Inventories also indicated a substantial rise this time of 5.85 million barrels. The data tended to highlight that the tightness as reported by the previous week’s figures had been reversed as the demand levels were not able to catch up with production. Overall the slack present currently in the US oil market if magnified could have an adverse effect on oil prices, yet may not be their only driver.
Market worries for US CPI rates
In the past few days there were considerable market worries for the release of the US CPI rate for July. The rates did actually show an acceleration yet beyond market expectations. The question though remains whether the market believes that the acceleration would be sufficient for Fed policymakers to proceed with another rate hike in the bank’s September meeting. Should the bank’s policymakers start increasingly signaling that another rate hike is possible, then the market due to fears of reduced economic activity in the US may drive oil prices lower as lower demand may be anticipated. On the other hand, should the acceleration not be considered sufficient for the bank to actually proceed with another rate hike, we may see oil prices getting another boost as market expectations for increased demand may be enhanced.
OPEC’s production and demand outlooks
Another factor that seems to drive oil prices is OPEC’s intentions. On the production side, the oil-producing cartel keeps levels low which in turn implies a tight supply side supporting oil prices. Yet also the demand outlook of OPEC for the oil market seems to remain healthy in the second half of the year, and furthermore seems to be sticking to its forecast for a robust demand in 2024. It’s characteristic that the oil production organization is expecting a rise in oil demand by 2.44 barrels per day (bpd) in 2023 and 2.25 million bpd in 2024. The Organization cites “In 2024, solid global economic growth amid continued improvements in China is expected to boost the consumption of oil,”. The upbeat outlook in conjunction with the tight supply side, given that Saudi Arabia seems to have delivered on its production cuts, may continue to be a positive factor for oil prices in the coming week.
China’s demand
Yet we tend to maintain our worries for the oil demand outlook of China. We note that the trade surplus of China may have widened in July, which could be a positive for the Chinese economy as it’s international trading transaction caused a wider inflow of wealth yet the result was achieved from simultaneously contracting growth rates in both imports and exports, which in turn may imply also a contraction of economic activity. In addition to that, we also note that the Chinese economy seems to be entering a deflationary mode highlighting the issues it faces. Given that China’s economy is mainly manufacturing-driven, a slowing of growth could have an adverse effect on oil prices and should the market’s worries for the recovery of China intensify we may see them having an adverse effect on oil prices.
Technical Analysis
WTI Cash 4H Chart
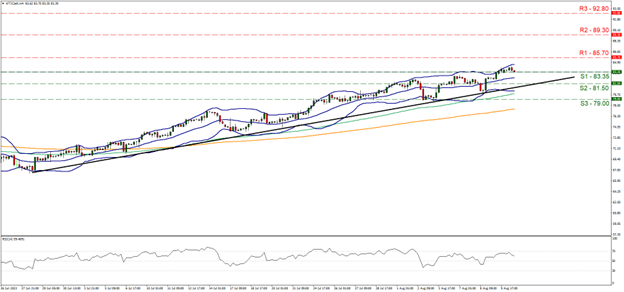
- Support: 83.35 (S1), 81.50 (S2), 79.00 (S3)
- Resistance: 85.70 (R1), 89.30 (R2), 92.80 (R3)
WTI’s price continued to be on the rise in the past week, reaching and actually breaking the 83.35 (S1) resistance line, now turned to support. We tend to maintain a bullish outlook for the commodity’s price as the upward trendline guiding it since the 28th of June remains practically intact and the RSI indicator remains near the reading of 70, implying a rather bullish sentiment on behalf of the market. Should the bulls maintain control over black gold’s price, we may see it breaking the 85.70 (R1) resistance line with the next possible target for the bulls being the 89.30 (R2) resistance base, while even higher we note the 92.80 (R3) resistance level. Should the bears take over we may see oil’s price breaking the 83.35 (S1) support line and aim for the 81.50 (S2) support level, while even lower we note the 79.00 (S3) support barrier which held its ground on the 3rd of August.
Disclaimer:
This information is not considered investment advice or an investment recommendation, but instead a marketing communication. IronFX is not responsible for any data or information provided by third parties referenced or hyperlinked, in this communication.


