

Compare to last report , Gold’s price appears to have relatively stabilized yet with key events occurring and the ongoing geopolitical tensions, that picture could quickly change. In today’s report we intend to have a look at the upcoming release of the US employment data and geopolitical issues in the Middle East, all on a fundamental level for the gold market. For a rounder view, we conclude the report with a technical analysis of gold’s four-hour chart.
US employment data due out this week
The US employment data for November is set to be released this Friday and as always, the NFP and Unemployment rate may take centre stage. The expectations by economists are for the Non-Farm-Payrolls figure to come in at 202k , vastly exceeding last month’s disappointing figure of 12k, and for the unemployment rate to tick up to 4.2% from 4.1%. Setting aside the NFP figure, the expected uptick in the unemployment rate may amplify calls for the Fed to cut interest rates in their last meeting of the year, as it may imply a loosening labour market.
Yet, we would like to stress that a mere 0.1% uptick in the unemployment rate does not necessitate a collapse of the US labour market. However, should the unemployment rate come in as expected it could weigh on the dollar for the reasons we mentioned above. On the other hand, should the NFP figure vastly exceed expectations it could potentially mitigate the bearish implications on the dollar, as it may counter the argument of a loosening US labour market.
Overall, the final employment data for the year may set the tone heading into next year and thus any deviations and their positive or negative implications on the dollar may be amplified by market participants.
Syria in focus
Geopolitical tensions may be slightly easing between Israel and Hezbollah following the ceasefire deal, yet in other parts of the Middle East tensions are rising. We are referring to the recent escalation in Syria, where Rebel forces backed by Turkey made significant gains over the weekend, in what can be described as a collapse of the regime forces which saw Aleppo and its surrounding regions being taken by the Rebel forces.
Moreover, the Kurdish forces have also decided to take advantage of the Syrian Army’s disorganization and have also made gains and captured territory. The vested interest from Turkey, Iran, Russia, Israel, and the US in the region may be of great concern as the proxy war heats up.
Therefore, should we see a more active involvement by the foreign nations we mentioned above, it may further increase geopolitical tensions in the region and thus may funnel safe haven inflows into gold which in turn may aid its price. In conclusion, the recent developments in Syria could lead to numerous nations being pitted against each other, in their attempt to garner influence in the region.
Thus, such an escalation in our view could aid gold’s price. On the flip side, should we see agreements between the power brokers in the region, it may have the opposite effect on gold’s price. In our view, we would not be surprised to see the recent situation in Syria continuing as the factions opposing Assad’s regime have got their “foot through the door”. Hence, we would not be surprised to see the power brokers taking a more active support role in the region in order to pursue their interests, which in turn could increase tensions in the region.
Gold Technical Analysis
XAUUSD 4H Chart
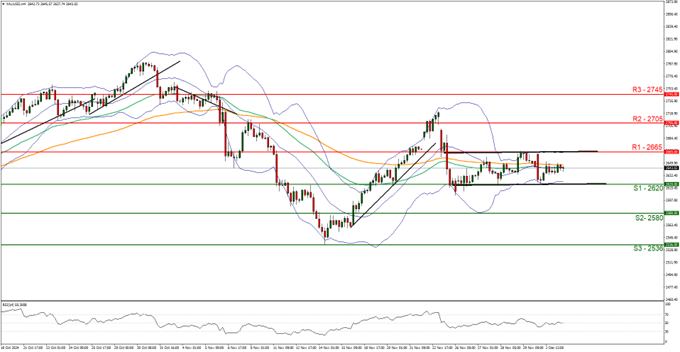
- Support: 2620 (S1), 2580 (S2), 2536 (S3)
- Resistance: 2665 (R1), 2705 (R2), 2745 (R3)
On a technical level, gold’s price appears to be moving in a sideways fashion, as seen by the sideways moving channel which was incepted on the 25th of November. We opt for a sideways bias for gold’s price and supporting our case is the RSI indicator below our chart which currently registers a figure near 50, implying a neutral market sentiment in addition to the aforementioned sideways moving channel.
For our sideways bias to be maintained we would require the precious metal’s price to remain confined between the 2620 (S1) support level and the 2665 (R1) resistance line. On the flip side, for a bullish outlook, we would require a clear break above the 2665 (R1) resistance line with the next possible target for the bulls being the 2705 (R2) resistance ceiling. Lastly, for a bearish outlook, we would require a clear break below the 2620 (S1) support line with the next possible target for the bears being the 2580 (S2) support level.
Disclaimer:
This information is not considered investment advice or an investment recommendation, but instead a marketing communication. IronFX is not responsible for any data or information provided by third parties referenced or hyperlinked in this communication.


