

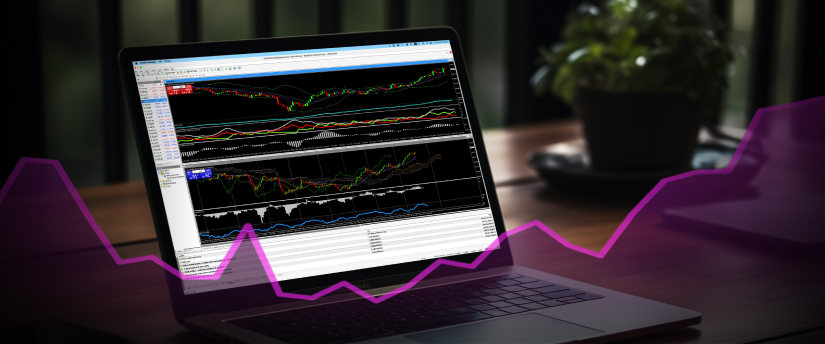
MetaTrader 4 is a viral trading platform worldwide. Global traders, particularly those engaged in forex trading, seek out MT4 because of its advanced technical analysis tools (indicators), an incredibly easy and intuitive user interface, and its automated (algorithmic) trading feature.
Since launching in 2005, the MetaTrader 4 platform has rightly earned international appeal, especially amongst those new to trading who want a system that simplifies the process rather than make it more stressful.
Technical analysis tools
A standout feature of the MT4 platform is its advanced technical analysis tools. More specifically, MetaTrader 4 offers traders 30 built-in indicators, over 2k free custom indicators, and 700 paid options. So robust are these indicators that they can provide an in-depth analysis of the market, no matter how complex.
What are Metatrader 4 technical indicators?
In the context of trading, indicators are basically mathematical calculations that can be applied to price, volume, or demand of a financial instrument.
These calculations are visible on a chart, above and below price information, and in a way that provides insights into the market’s potential future movements.
A technical indicator alerts traders to when specific conditions have been met, predicts price direction, and confirms existing analyses based on price action or other indicators.
Indicators are grouped into two categories:
- Leading indicators, which provide signals before a new trend or reversal occurs.
- Lagging indicators, which typically follow price action and are more confirmation,.
MT4 and indicators
As we’ve already mentioned, the MT4 platform offers an extensive variety of important indicators to serve the needs of different trading styles and trading strategies.
Whether you are a day trader, a scalper, a swing trader, or a news trader, you’re likely going to be referring to a number of indicators to make trading decisions.
Some of the most popular Metatrader 4 indicators include:
1. Moving averages (MA)
Moving averages are a prevalent tool in technical analysis, considered simple but also one of the most effective indicators.
They smooth out price data to identify trends over a particular window. Through MetaTrader 4, traders can customise the period and type of MA, allowing for more flexibility in technical analysis.
2. Relative Strength Index (RSI)
RSI measures the speed and change of price movements. It is used to identify overbought or oversold market conditions, oscillating between 0 and 100.
3. Bollinger bands
These are comprised of a middle band (a moving average) and two outer bands, one above and one below, which expand and contract based on market volatility. They assist traders in identifying oversold or overbought conditions.
4. Stochastic Oscillator
The Stochastic Oscillator is a momentum indicator. It compares a specific closing price of an instrument to a range of its prices over a particular period. Like the Bollinger Band, it also helps to identify oversold and overbought conditions.
5. Moving Average Convergence Divergence (MACD)
The MACD is a trend-following momentum indicator. It helps traders identify changes in the strength, direction, momentum, and duration of a trend in a stock’s price. It is often relied upon to spot trend changes.
6. Fibonacci Retracement
The Fibonacci Retracement indicator is used to identify potential support and resistance levels within the price movements of an asset. The Fibonacci sequence is a series of numbers created by taking 2 numbers and adding them together to form a third number.
Then the second and third numbers are added together to form a fourth. And so it carries on. The sequence usually starts with 0 and 1 but can start with 1 and 1, depending on the variation.
The ratio of the last number over the 2nd last number is approximately equal to 1.618, which is closely related to the golden ratio that appears frequently in art, architecture, and in nature.
7. Average true range (AVT)
The AVT measures the volatility of the market by calculating the average range of price fluctuations over a specific timeframe. Traders use this indicator to assess the degree of price movement of an asset and to identify potential entry and exit points.
ATR is calculated by first identifying the true range, which is the greatest of 3 values: the current high minus the current low, the previous close minus the current high, and the previous close minus the current low.
Once this has been calculated for a specific timeframe, e.g. 14 days, the ATR is then obtained by taking the moving average of these true range values over the selected period.
8. Ichimoku Cloud
Also known as the Ichimoku Kinko Hyo, this trend-following tool offers insights into an instrument’s potential momentum, trend direction, and possible support and resistance levels.
What makes this indicator unique is that it provides a market overview in a single glance, unlike other indicators, enabling traders to assess multiple factors. A core feature of this tool is the cloud itself.
A possible uptrend is indicated if a price is above the cloud, and vice versa. Cloud thickness also offers information, e.g., the thicker the cloud, the stronger support and resistance.
The Ichimoku Cloud is comprised of 5 lines: Tenkan-sen, Kijyun-sen, Chikou Span, Senkou Span A, Senkou Span B, and Kumo.
9. Parabolic Stop and Reverse (SAR)
The parametric SAR is utilised for identifying trend direction and potential price reversals. The indicator uses a method called stop and reverse to establish entry and exit points, appearing on a chart as a series of dots above or below the price of an instrument, depending on the direction the price is heading.
10. Money Flow Index (MFI) and Metatrader 4
This technical indicator is used to measure the strength of money flowing into and out of an asset over a specific period. It uses price and volume data for identifying overbought or oversold signals in an asset. There are, of course, a great many other MT4 indicators for one to pick from and use in technical analysis.
Regardless of your choice of indicators, however, utilising effective risk management techniques in the course of trading is essential because gains are not guaranteed and the risk of incurring losses is high.
Be it stop-loss orders to minimise losses or take-profit orders to lock in profits, ensure you have proper measures in place.
Additionally, consider signing up for a demo trading account to get some practice utilising some of MT4’s free indicators. A demo account offers a simulated trading environment for you to trade in.
Using virtual funds, you can test out any manner of trading strategy and use indicators to help you make trading decisions. In this way, you have the peace of mind that your own money is safe while you gain the necessary experience to move to a live trading environment.
Furthermore, engage in some learning to acquire as much trading-related knowledge as you can, particularly on technical analysis, which is a core component of trading the markets. Be this blogs, videos, articles, podcasts, webinars, seminars; take your pick. The internet is an infinite resource of information.
Trading with IronFX
IronFX is a leading global broker with clients worldwide. The broker provides a top-tier trading experience. It offers flexible trading conditions.
Traders can choose from multiple account types. The forex broker supports a wide range of trading instruments. These instruments include forex, stocks, indices, futures and metals.
IronFX ensures fast trade execution. Withdrawals and deposits are seamless. Market access is available via the MetaTrader 4 (MT4) platform. MT4 is one of the world’s most renowned trading systems. It is widely used by global traders.
The IronFX Academy also offers an abundant source of educational resources to boost one’s skills and acquire fundamental trading insights.
Disclaimer:
This information is not considered investment advice or an investment recommendation, but instead a marketing communication. IronFX is not responsible for any data or information provided by third parties referenced or hyperlinked in this communication.


