

Gold’s price moved lower since our last report and seems to have stabilised somewhat since yesterday. Today we are to discuss the fundamental challenges laid ahead for the precious metal, the negative correlation of the USD with gold, the recent movement of US Yields, as well as upcoming financial releases that may affect the direction of gold’s price action and also add a note for the possible implications of the Fed’s interest rate decision on gold’s price. Finally, we will be concluding this report with a technical analysis of gold’s daily chart.
USD’s sideways motion blurs the waters for gold
We make a start with the negative correlation of gold’s price to the USD. Overall the sideways motion of USD’s price tended to blur its negative corelation with gold’s price. Characteristically the USD Index ended the past week and Monday’s movement in the greens against its counterparts in an indication of a subtle strengthening of the greenback against its counterparts.
On the other hand, gold’s price ended the past week in the reds yet failed to materially retreat on Monday despite the relative strengthening of the USD. Nevertheless should the USD’s direction become clearer and its movement more intense, we may see that being reflected also on gold’s price in reverse, in the coming days.
Drop of US yields leaves gold unaffected
Since our last report we note that US yields uniformly dropped and stayed at relatively low levels. It’s characteristic that the 2 year US bond yield reached levels not seen since the beginning of February, while the 5 year, 7 year and 10 year bond yields are nearing March levels.
The drop of US yields tends to imply that gold’s alternative as a safe haven, namely US bonds, may not be as attractive for investors and thus divert their attention towards the precious metal. Yet that does not seem to be the case in the past few days as gold’s price failed to benefit from the drop of US yields.
We expect that should US yields continue to fall, we may see them having a positive effect on gold’s price in the next few days.
The Fed’s interest rate decision
Maybe the main event in the week for gold traders is the release of the Fed’s interest rate decision tomorrow. The bank is widely expected to remain on hold, keeping rates at the range of 5.25%-5.50%. It’s characteristic that Fed Fund Futures (FFF) imply a probability of 96% for such a scenario to materialise.
At the same time, FFF also imply that the market expects the bank to start cutting rates in September and deliver another two rate cuts until the end of the year (November and December). Hence should the bank remain on hold as expected, we may see the market’s attention turning towards the Fed’s accompanying statement and Fed Chairman Powell’s press conference, half an hour later.
Should the bank try to prepare the markets for a possible rate cut in the September meeting, we may see the market’s expectations being verified and thus provide a lift for gold’s price.
On the flip side should the bank seem prepared to keep rates at the current level for longer, we may see the USD gaining asymmetrically as it would force the market to reposition its expectations and thus see a bearish effect on gold’s price.
The US employment report for July
Besides the Fed’s interest rate decision on Wednesday, we also highlight the release of July’s employment report with its Non-Farm Payrolls figure on Friday.
Analysts expect the NFP figure to drop to 175k from June’s 206k, the unemployment rate to remain unchanged at 4.1% and the average earnings growth rate to slow down to 3.7% yoy if compared to June’s 3.9% yoy. Forecasts tend to overall show a cooling of the US employment market. In such a scenario we may see the USD losing some ground and if so could expect the price of gold gaining somewhat.
Yet uncertainty is high as the actual rates and figures seldomly meet the forecasts, hence we may see increased volatility at the release. Especially should the report show that the US employment market tightened somewhat over the current month we may see the USD gaining with an adverse effect on gold’s price. Such a scenario could force also the market to alter its expectations regarding the Fed.
Gold Technical Analysis
XAUUSD Daily Chart
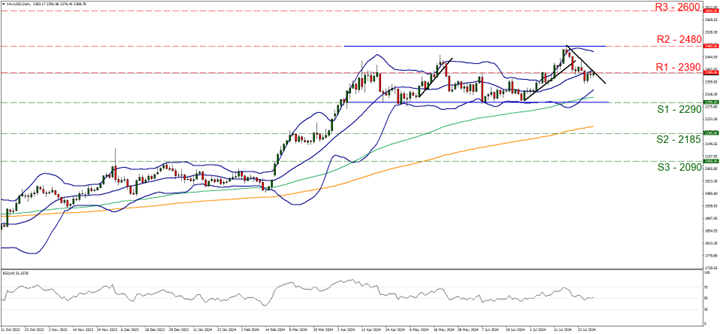
- Support: 2390 (S1), 2480 (S2), 2600 (S3)
- Resistance: 2290 (R1), 2185 (R2), 2090 (R3)
Since our last report gold’s price dropped breaking the 2390 (R1) support line, now turned to resistance. The precious metal’s price corrected higher and stabilised somewhat, yet remained at the 2390 (R1) level.
Please note that the RSI indicator is currently running along the reading of 50, implying a rather indecisive market which could allow the stabilisation to remain. Also the Bollinger bands have started to converge in a signal of reduced volatility for the bullion’s price to be reduced, that may also allow the price of gold to stabilise somewhat. Hence, we tend to maintain a bias for the sideways motion to be maintained for the time being.
It should be noted that the precious metal’s movement seems to be threatening the downward trendline guiding it since the 17th of July, which tends to create a make or break situation for gold’s price. Also, given the high impact financial releases expected in the coming days, the overall picture looks like the calm before the storm.
Should the bulls take over, we may see the price of gold breaking the prementioned downward trendline, in a first signal that the bearish movement has been interrupted, break the 2390 (R1) resistance line and take aim if not reach the 2480 (R2) resistance level.
Should the bears maintain control over the precious metal’s price, we may see it aiming for the 2290 (S1) support line, which withheld the bearish pressure a number of times since the second half of April, proving its worth.
Disclaimer:
This information is not considered investment advice or an investment recommendation, but instead a marketing communication. IronFX is not responsible for any data or information provided by third parties referenced or hyperlinked in this communication.


