The stochastic oscillator (also known as the stochastic indicator) is the most widely used forex technical indicator. It was the brainchild of the international market analyst George Lane in the 1950s and was popularised later in the 1980s.
The stochastic indicator tracks price momentum, which can be used to predict possible price reversals. There is no simple leading indicator which allows investors to choose perfectly when to enter or exit the market; they must be used in conjunction with other indicators and analysis.
While there is not one market indicator that can tell us when to buy or sell a stock with the exact timing and price, there are indicators out there that can identify some of the potential market turning points.
As trader, you have the freedom and choice to evaluate the accuracy of the readings provided by indicators and choose which signals might support your trading strategy.
What is the stochastic oscillator?
The stochastic oscillator is a technical tool that measures current price of an asset in relation to the range of the last 14 periods. But note: a “period” could be a week, a day, an hour, a four-hour block, a five-minute block, or any other time period a trader may use. The majority of trading platforms enable you to choose from standard timescales.
Stochastic indicator formula
The majority of electronic trading platforms nowadays will do the stochastic calculations for you, but it’s good to know the formula so that you understand the “why” behind the indicator.
%K = [(C – L14) / (H14 – L14)] x 100.
%K = Stochastic indicator’s current value
C = current closing price
L14 = The asset’s lowest price during the last 14 periods.
H14 = The highest price within 14 periods.
%D = (current %K + last period %K + 2 periods ago %K) / 3.
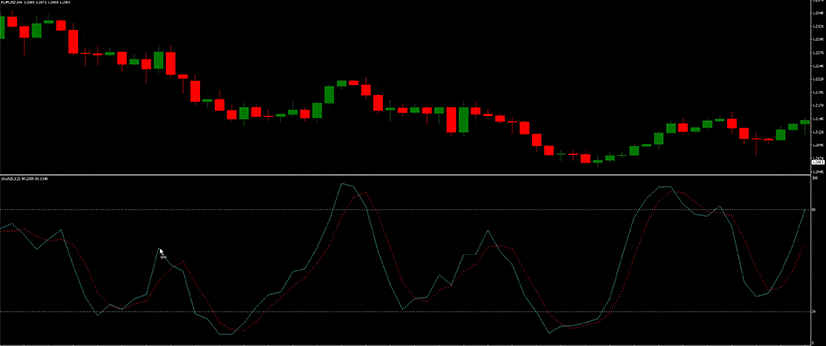
The interpretation of the stochastic indicator chart is very simple. It comprises two lines—the faster %K and the slower %D. For any listed asset (stock, forex, futures contract, or whatever you’re trading).
% K is a measure of the previous period’s close price relative to the lowest price over a look-back period (usually 14 periods), divided by the range (the distance between the high and low) over the last 14 periods.
%D is a moving average of %K readings, usually for the past three periods. Multiply the readings by one hundred to get from percentage format to a scale of zero to 100. It is known as the stochastic oscillator since the lines oscillate up and down in a wave-like fashion and they always remain enclosed within the area between 0 and 100.
How does the stochastic oscillator work?
Stocks and other securities rarely move in a straight fashion. Even when there is a general tendency, there are still wave movements, up and down. The indicators that include oscillators like Stochastics and RSI (another popular technical indicator) “capture” the waves in the movement of prices between certain boundaries, which allows you to measure the strength or “momentum” of the fluctuations.
Fundamentally, faster %K and slower %D lines are determined to demonstrate the correlation between current and past prices. The idea is that by capturing the maximum price range within a limited and quantifiable extent, the trader is able to determine when the price moves, which may be running out of steam and is therefore about to stall or reverse.
How to use the stochastic oscillator
The stochastic indicator is a trading tool used to assess if the price of an asset may be overbought or oversold. The oscillator indicates when prices are about to change and this helps traders identify the best time and price to buy or sell an asset.
Generally, RSIs over 80 mean the asset is overbought, and it is oversold when it is below 20.
How do you respond to an overbought or oversold reading?
The way to respond when an asset enters the oscillator’s overbought or oversold domain may entirely depend on your outlook (short-term or long-term) and strategies.
For instance, does an overbought stock with reversed reading imply a small dip, a larger correction, or a long-term downtrend? It’s hard to say, especially when you just rely on stochastics.
Possible actions to take:
- Buy into the momentum
- Sell on the overbought signal
- Hedge a long exposure (e.g., buy a put options contract on the stock)
Thus, it is worth noting that your position holdings, your approach, your risk tolerance and your trading and investing goals determine how you use stochastic signals.
If an asset is in a strong trend, the %K and %D lines may stay above the overbought or below the oversold thresholds for an extended time period. You can refer to some other technical and fundamental indicators to compliment or fine-tune stochastic readings.
What are the advantages and disadvantages of employing stochastics?
The biggest advantage of using a stochastic indicator is that it enables you to forecast potential trend reversals and therefore spend some time analysing your market and preparing for a potential trade. Additionally, the indicator itself is user-friendly and straightforward to understand.
The biggest disadvantage is that stochastic indicators are not effective when the market isn’t trending. In other words, the stochastic oscillator will keep on producing unreliable or “false” signals when markets experience volatility or trade in the range.
As any seasoned trader will testify, wrong signals would cause you to buy and sell too early and hit a stop-loss order before a profit target is achieved. On the other hand, for a trader whose goal is to “buy low, sell high”, it is most likely that trading on fake signals ends up with the complete opposite scenario.

The bottom line
Consider the stochastic oscillator as a type of early warning alert system with the sole mission of singling out market conditions such as whether an asset is overbought or oversold. You have to determine whether the imaginary signals the oscillator produces match the real market’s supply and demand conditions.
A stochastic indicator does not yield 100% accurate information and recommendations (no technical indicator can); however, stochastic signals will often point to those potential market opportunities and provide you with some time to prepare for them, should they actually happen.
Trading with IronFX
If you love technical analysis and would like to learn more to make more accurate decisions when trading, you may enjoy exploring our wide range of educational materials. You can find educational resources under our Academy section on our website or informative articles and analysis under our Blog.
You can also explore third-party resources IronFX offers to its clients, such as premium access to the VIP Room, where you can chat with our experts and request analysis for your favourite instruments, or access Trading Central tools. If you would like to find out how to access all these, you can open an account with us and explore all our resources efficiently.
Disclaimer:
This information is not considered investment advice or an investment recommendation, but instead a marketing communication. IronFX is not responsible for any data or information provided by third parties referenced or hyperlinked in this communication.


