

WTI traders may have noticed the decline in oil prices since the beginning of this week, in contrast to our last report. In the current report we intend to have a look at the state of the US oil market, yet also on an international level, discuss factors on the demand and supply sides that drive oil prices. To conclude the report we will also provide a technical analysis of WTI’s daily chart.
Oil: Overview Report
US demand for Oil declines
The state of the US oil market seems to have changed slightly. Characteristically the number of active oil rigs in the US decreased by five, according to Baker Hughes from 511 to 506, a reversal when compared to our report last week.
The decrease of active rigs seemed to imply a reduction in demand from the US oil market and thus may have a bearish effect on oil prices should it continue on its current trajectory. Furthermore, we note that US oil reserves have increased according to the American Petroleum Insitute.
The increase in inventories, which was reported was not immaterial, as it came in at roughly 4.9 million barrels. Also, EIA reported a increase of US reserves, further indicating a reduction in demand, as a significant increase of 7.265 million barrels was reported.
Overall the data mentioned, tend to highlight that oil production levels, have surpased the aggregated demand for the commodity, which could be viewed as a bearish indicator for oil prices. Should we see the data regarding the US oil market show a reduction in demand, we may see them having a bearish effect on oil prices.
OPEC Oil output reduced in April
According to a survey conducted by Reuters, OPEC oil output has declined in April, which per the report has been in part due to lower exports from Iran,Iraq and Nigeria. Specifically, OPEC countries produced 26.49 million bpd in April, which is down by 100,000 bpd from March’s total.
The reduction in supply could provide support for oil prices, should the reduction continue, as it may place a strain on the supply chain. On another note, a separate report from Reuters again, citing its sources, claims that OPEC and its allies may be preparing to extend their voluntary oil production cuts beyond June, should demand fail to pick up.
Therefore, with the next OPEC meeting set to occur on the 1st of June, should the oil cartel decide to extend their production cuts further into the year, it may continue to hamper oil supply which in turn could provide support for oil prices.
US Strategic Petroleum reserve
The US Strategic Petroleum reserve remains near its four decade low, which may be a concern given the elevated geopolitical risks seen just this year. As such, should the US decide to begin replenishing its SPR in an accelerated manner, it could provide support prices. Moreover, it should be noted that the US has been accumulating oil barrels in its SPR, since June 2023, implying a long term increase in demand for oil.
Yet the accumulation of oil barrels in the bigger picture appears to have been minimal, with an increase of roughly 16 million barrels until February 2024, according to data from the EIA.
Nonetheless, should a significant accumulation of oil barrels occur, or an announcement of intent is given by the US Government to replenish their depleting supply, then it could provide support for oil prices.
Financial releases and fundamentals
We note the release of China’s PMI figures and the US S&P PMI figure for the manufacturing sector earlier on this week. The expansion of economic activity in the manufacturing sectors of the US and China could have a bullish effect on oil prices as it would imply a wider demand for the commodity.
Yet, the US ISM Manufacturing PMI figure came in lower than expected, implying a contraction in economicactivity for the manufacturing sector which may have mitigated the positive implications on oil prices, stemming from the ChineseManufacturing PMI figures and the US’s S&P manufacturing PMI figure.
Nonetheless, given China’sstatus as the largest oil importer in the world, the better than expected manufacturing PMI data, may provide support for oil prices in the long run, should China’s economic recovery continue. In turn, should the US manufacturing data continue to send out mixed signals, it could amplify the impact of China’s manufacturing PMI releases which could provide a clearer picture of future demand for oil.
Oil: Technical Analysis
WTI Daily Chart
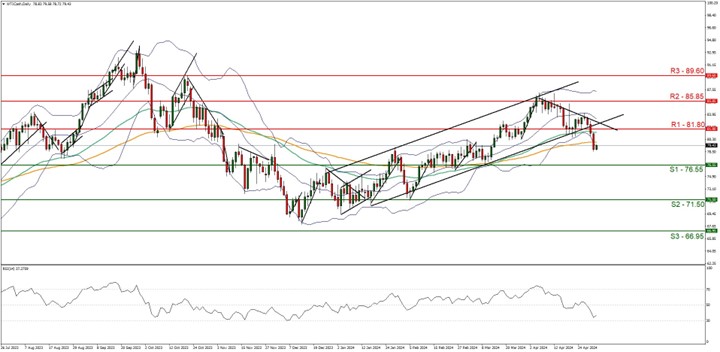
- Support: 76.55 (S1), 71.50 (S2), 66.95 (S3)
- Resistance: 81.80 (R1), 85.85 (R2), 89.60 (R3)
We switch our sideways bias in favour of a bearish outlook, as the commodity has now not only broken below our upwards moving channel which was incepted on the 18th of January, but has also now formed a downwards moving trendline which was incepted on the 5th of April.
Furthermore, the RSI indicator below our chart currently registers a figure near 40 implying some bearish market tendencies. For our bearish outlook to continue, we would like to see a break below the 76.55 (S1) support level, with the next possible target for the bears being the 71.50 (S2) support base.
On the flip side, for a sideways bias, we would require the commodity’s price to remain confined between the sideways channel defined by the 76.55 (S1) support level and the 81.80 (R1) resistance line. Lastly, for a bullish outlook, we would require a clear break above the 81.80 (R1) resistance line, if not also our downwards moving trendline, with the next possible target for the bulls being the 85.85 (R2) resistance level.
Disclaimer:
This information is not considered investment advice or an investment recommendation, but instead a marketing communication. IronFX is not responsible for any data or information provided by third parties referenced or hyperlinked, in this communication.


