

Earlier this week, crude prices reached their lowest levels in over 15 months as a result the aftershocks of the recent confidence crisis in the banking industry, that outright overshadowed energy traders’ optimism from China’s reopening prospects. As contagion worries subsided however, optimism slowly re-entered the picture and lifted WTI near the $70 per barrel where it is currently traded at. In this report we aim to shed light on the catalysts driving WTI’s price, assess its future outlook and conclude with a technical analysis.
IEA estimates oil demand to hit new highs in 2023
Last week the International Energy Agency upwardly revised its global oil demand estimates for 2023 citing that a strong rebound in worldwide travelling alongside China’s return to normalization, would push consumption to record highs. In its monthly report, the organization foresees that the global economy would require additional 2 million barrels per day extra this year when contrasted with energy demand levels of 2022 and boldly states “Global oil demand growth started 2023 with a whimper but is projected to end the year with a bang”. IEA also places significant attention on China’s solid economic momentum that drives energy demand levels higher, since the most significant oil consumer in the world has now pushed the pedal to the metal and pursued its full-fledged reopening agenda after the abrupt abandonment of its strict zero covid policy. It also added that “Chinese air traffic with domestic flights is now well above pre-pandemic levels”, which is seen as another solid reason for an even stronger rebound in demand.
Contagion panic eases as UBS takes over Credit Suisse
Following the dramatic events of a possible collapse of Credit Suisse last week, market nerves calmed as SNB forced UBS to take over its distressed competitor in an attempt to restore market confidence and ensure financial stability. Even though it is too soon to tell whether the recent turmoil is ultimately over, the market apprehended the news positively. Therefore, since the prospects for a systemic overspill scenario dissipated, energy bulls entered the picture and helped put a floor under WTI prices. Adding more confidence to the case of bulls were the comments by US Treasury Secretary Janet Yellen who stated that the government is willing to take further action to protect deposits, however yesterday she stated that the government is not considering a “blanket insurance” policy. Further comments and developments therefore will be monitored closely as we move forward since a reignition of contagion worries could once again put extensive pressure on WTI prices.
Crude inventories keep on piling up
On Tuesday the weekly API crude oil inventories figure pointed to the buildup of 3.2 million barrels in stocks, higher than the expectation for a drawdown of -1.4 million, while yesterday EIA’s weekly oil inventories recorded a rise of 1.1 million barrels of crude, exceeding expectations of -1.6 million drawdowns for the same period. The results suggest weakening demand for crude however WTI’s strength since the start of the week indicates that the aforementioned buildups had no material impact on pricing. It is important to strike out that the API crude oil inventories have been recording consecutive pile-ups since the start of the year with only two weeks since then recording a drawdown. Similarly, EIA crude inventories recorded have been recording excessive buildups for the same period with only one week reporting otherwise. Overall, the apparent continuation of large pileups in crude stocks from a three-month historical point of view reflects the deteriorating demand for oil which could be explained by expectations for a slowdown in economic activity from energy traders and the market as a whole. Lastly, we would note that last Friday the Baker Hughes oil rig count showed that the number of active oil rigs in the US has dropped by a count of 1 reaching a total of 589, which could serve as another indication for a slowdown in demand.
التحليل الفني
WTICash 4H Chart
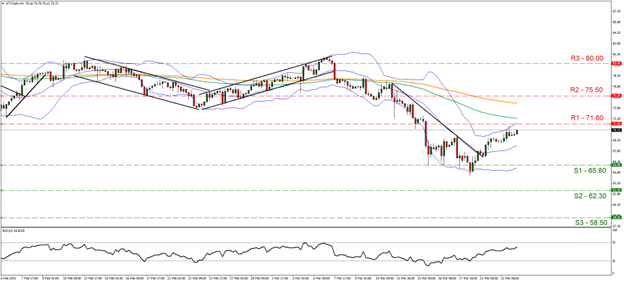
- Support: 65.80 (S1), 62.30 (S2), 58.50 (S3)
- Resistance: 71.60 (R1), 75.50 (R2), 80.00 (R3)
Looking at مؤشر WTICash 4-hour chart we observe crude finding support around the $65 range earlier this week, which put a floor under its prices and facilitated the bounce towards the $70 per barrel where it is currently traded at. We hold a sideways price action bias for the WTI given the break above the descending trendline and supporting our case is the RSI indicator below our 4-hour chart which is currently registering a value of 55, showcasing indecision surrounding the commodity. Should the bulls take the initiative, we may see the break above the $71.60 (R1) resistance level and the move near the $75.50 (R2) resistance barrier. Should, on the other hand, the bears take over, we may see the break below the 65.80 (S1) support level and move close to the $62.30 (S2) support base.
If you have any general queries or comments relating to this article please send an email directly to our Research team at research_team@ironfx.com
إخلاء المسؤولية:
This information is not considered investment advice or an investment recommendation, but instead a marketing communication. IronFX is not responsible for any data or information provided by third parties referenced or hyperlinked, in this communication.


