

Oil prices have remained relatively unchanged since the start of the week, showing some signs of stabilization. In today’s report, we are to have a look at the data relating to the US oil market and continue to view the fundamentals surrounding the international oil market. To conclude the report we will also provide a technical analysis of WTI’s daily chart.
US oil market remains tight
The data on the ground of the US oil market tend to be quite telling for the course of oil in the States, in the past week. We make a start with the Baker Hughes oil rig count that showed that the number of active oil rigs in the US dropped by one to 478. The release may imply that some weakness in oil demand persists as the number of active oil rigs remains low. However, the API weekly crude oil inventories figure, reported a substantial drawdown, of -4.440 million barrels if compared to the prior reading of indicator of -1.923 million barrels. The release implied that the US oil market remains tight as demand levels exceeded the cumulative oil production. Similarly, the EIA also confirmed the tightness of the US oil market as it reported a drawdown of -4.870 million barrels, which was higher than prior week’s drawdown of -3.443 million barrels, yet confirms that oil production did not satisfy the demand of the US oil market. Overall the data, seem to align that the tightness of the US oil market may have increased. As such, should we see additional data implying that the US oil market remains tight in the coming week, we may see oil prices getting some support.
China remains a source of concern
China’s GDP rate for Q2 came in lower than expected at 4.7% on a year-on-year level and 0.7% on a quarter-on-quarter basis. The lower-than-expected growth rate may be a cause for concern, as a slowdown in economic growth for the largest oil importer in the world, may imply that demand for oil may also decrease in the future. Therefore, the implications of oil demand from China decreasing in the future may have capped the potential price gains for crude oil during the week. However, it should be said that China’s industrial production rate for June came in higher than expected at 5.3% versus the expected rate of 4.9%, which could insinuate that demand for oil from China’s industrial sector may not be on the decline just yet. In turn, the release may alleviate some concerns at least on a short-term basis in regards to oil demand stemming from China. Nonetheless, should further financial releases stemming from China imply that economic activity may be slowing down, it could weigh on oil prices and vice versa.
Kuwait’s new discovery
According to a report by Reuters, the Kuwait Petroleum Corporation stated this Sunday that it had made a “giant” oil discovery in the Al-Nokhatha field east of the Kuwait island of Failak, with oil reserves estimated at 3.2 billion barrels. The recent discovery made by Kuwait could potentially weigh on oil prices, as should Kuwait exploit their newly discovered oil reserves, it could increase the supply of oil into the market which in turn may have a negative impact on oil prices should supply exceed demand. However, the development and extraction of oil may not be immediate, as an impact on oil prices may occur at a later point in time.
التحليل الفني
WTICash Daily Chart
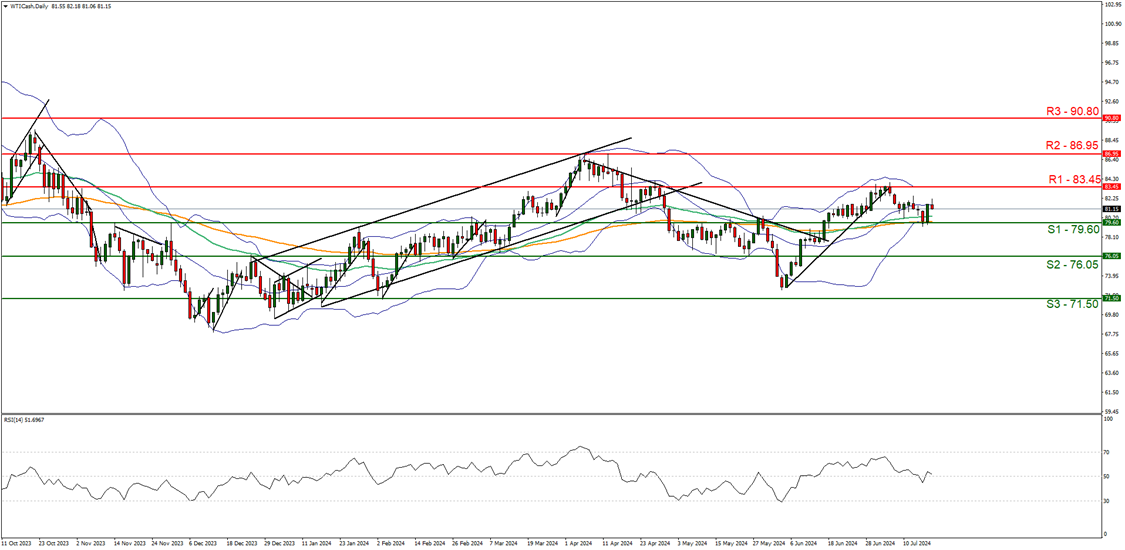
• Support: 79.60 (S1), 76.05 (S2), 71.50 (S3)
• Resistance: 84.10 (R1), 86.80 (R2), 89.50 (R3)
WTI’s price appears to have stabilized during this week, with the commodity’s price remaining between the 79.60 (S1) support level and the 83.45 (R1) resistance line. We maintain a sideways bias for the commodity’s price and supporting our case is the narrowing of the Bollinger bands which may imply low market volatility, in addition to the RSI indicator below our chart which currently registers a figure near 50, implying a neutral market sentiment. For our sideways bias to continue, we would require the commodity to remain confined between the sideways moving channel defined by the 79.60 (S1) support level and the 83.45 (R1) resistance line. On the flip side, for a bullish outlook, we would require a clear break above the 83.45 (R1) resistance line, with the next possible target for the bulls being the 86.95 (R2) resistance level. Lastly, for a bearish outlook, we would require a clear break below the 79.60 (S1) support level with the next possible target for the bears being the 76.05 (S2) support line.
إخلاء المسؤولية:
This information is not considered investment advice or an investment recommendation, but instead a marketing communication. IronFX is not responsible for any data or information provided by third parties referenced or hyperlinked, in this communication.


