
Oil prices have corrected lower since the start of the week, yet show some signs of stabilisation. In today’s report, we are to have a look at the data relating to the US oil market and continue to view the fundamentals surrounding the international oil market. To conclude the report we will also provide a technical analysis of WTI’s daily chart.
US oil market remains tight
The data on the ground of the US oil market tend to be quite telling for the course of oil in the States, in the past week. We make a start with the Baker Hughes oil rig count that showed that the number of active oil rigs in the US remained unchanged at 479. The release despite the number not dropping, allowed for argumentation for the weakness of oil demand as the number of active oil rigs remains low. Furthermore, we note that API reported a substantially narrower drawdown, of -1.923 million barrels if compared to the prior reading of indicator of -9.163 million barrels. Despite the narrowing of the drawdown, the release implied that the US oil market remains tight as demand levels surpassed cumulative oil production. Similarly, the EIA also confirmed the tightness of the US oil market as it reported a drawdown of -3.443 million barrels, which was lower than prior week’s drawdown of -12.157 million barrels, yet confirms that oil production did not satisfy the demand of the US oil market. Overall the data, seem to align that the tightness of the US oil market may have eased, yet remains present and should we see additional data implying that the US oil market remains tight in the coming week, we may see oil prices getting some support.
Conflicting oil demand outlooks
About the demand side of the international oil market there seem to be conflicting signals. On the one hand, we note that the International Energy Agency (IEA) in its July 2024 report seems to be expecting oil demand growth to slow to just below a million barrels per day (bpd) in 2024 and 2025. The Agency is citing the possibility of lower oil demand from China as evident by Q2 2024, due to economic problems. We have to note that the Chinese manufacturing sector is still struggling to increase economic activity, which in turn may imply lower demand for oil. On the other hand, the Organisation of Petreleum Exporting Countries (OPEC) in its July monthly oil market report, seems ot be sticking to its expectatiosn for a robust oil demand. OPEC stated that global oil demand is to rise by 2.25 million bpd in 2024 and by 1.85 million bpd in 2025. For the current year the Organisation tends to cite strong demand “in the Northern Hemisphere during the summer driving/holiday season” and a resilience of economic growth which is expected also to feed global oil demand. Please note that the forecasts remain unchanged since last month. We tend to take the predictions of OPEC with a pinch of salt, given that a number of countries wishes for oil prices to remain at high levels. Yet overall, we would note that should there be any indications for increased/strong demand in the oil market, we may see oil prices gaining.
The Palestinian effect
We have to note that the situation in Gaza continues to affect oil prices. As a rule of thumb, any escalation of tensions in the besieged city, tends to be perceived as a threat for the international oil supply, while any easing of tensions in the area tends to weaken oil prices. For the time being truce negotiations are ongoing in Doha and any indications that progress is being made, tends to weigh on oil prices and vice versa. Yet we have to note that the Israeli Defence Forces (IDF) has instructed Palestinians to leave Gaza southwards, as a new offensive is seemingly underway in the noth part of the city. Definitely any military actions are undermining the truce negotiations and intensify tensions, thus may support oil prices. At this point we have to also note the possibility of a full blown war in the north of Israel, at the Lebanese borders with Hezbollah. Also skirmishes along the Israel-Lebanese borders are ongoing and the possibility of a full blown war in the north of Israel, cannot be ruled out. Yet Hezbollah leader Nasrallah, has stated that Hamas in Doha, is negotiating on behalf of of the entire Axis of Resistance. Hence it is reasonably expected that any truce deal could also be covering that side of the front.
التحليل الفني
WTI Cash Daily Chart
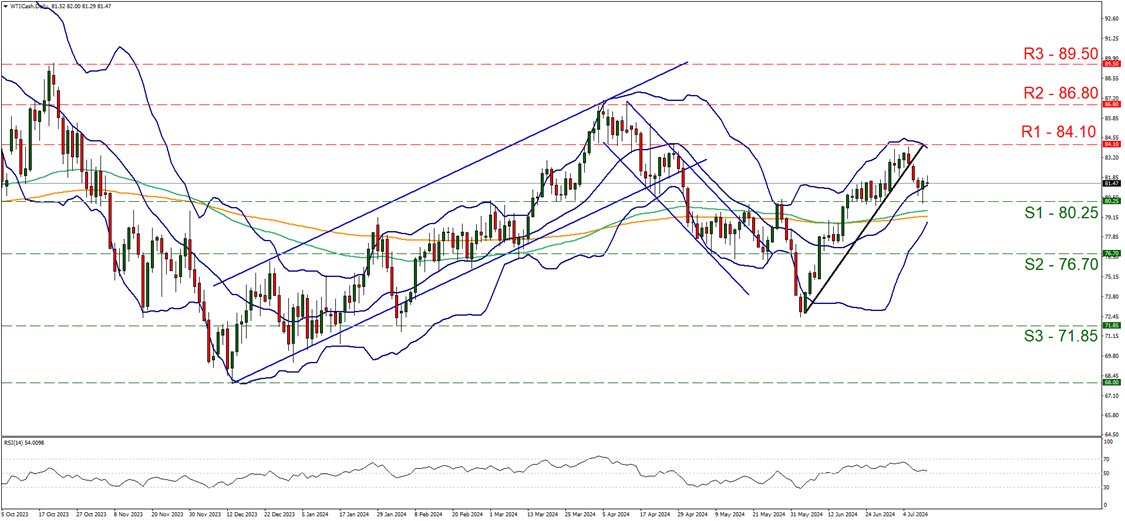
- Support: 80.25 (S1), 76.70 (S2), 71.85 (S3)
- Resistance: 84.10 (R1), 86.80 (R2), 89.50 (R3)
WTI’s price dropped over the past few days yet yesterday hit the floor on the 80.25 (S1) support line and bounced. Given that WTI’s price action on Monday, broke the upward trendline guiding the commodity’s price since the 4th of June yet was forced to respect he 80.25 (S1) support line yesterday, we tend to maintain a bias for a sideways motion to be maintained. Furthermore we note that RSI indicator below our daily chart runs laong the reading of 50, implying a rather indecisive market, which could allow the sideways motion to continue for now. For a bullish outlook, we would require the commodity’s price to form a higher peak than the last one and for WTI’s price action to do so, it has to break the 84.10 (R1) resistance line and start aoiming for the 86.80 (R2) resistance level. Should the bears take over, we may see WTI’s price action breaking the 80.25 (S1) support line and start aiming the 76.70 (S2) support base.
إخلاء المسؤولية:
This information is not considered investment advice or an investment recommendation, but instead a marketing communication. IronFX is not responsible for any data or information provided by third parties referenced or hyperlinked, in this communication.


