
Oil prices appear to have moved in an upwards direction since the beginning of the week. In today’s report, we are to have a look at the data relating to the US oil market and continue to view the fundamentals affecting the demand side of the international oil market. To conclude the report we will also provide a technical analysis of WTI’s daily chart.
Mixed signals from the US oil market
There were some mixed signals regarding the US oil market over the past week. Starting with the Baker Hughes oil rig count, the indicator’s reading last Friday, showed that the number of active oil rigs in the US increased from 483 to 485.
The release tended to imply the of need for US oil producers to activate additional oil rigs to pump out more oil and could imply an increase of oil demand in the US oil market, which could be interpreted as bullish for oil prices.
On Tuesday, we would like to note the release of the API weekly crude oil inventories figure. The indicator’s reading was expected to show a drawdown of US oil inventories, yet that was not the case.
The release showed that there was an increase in oil inventories by approximately 1.96 million barrels,. The release tended to imply that demand in the US oil market was below the production levels thus allowing for the notion that the US oil market may have loosened slightly.
The picture changed once again on Wednesday with the EIA reported a drawdown of US oil inventories, by -1.63 million barrels, implying that the tightness of the US oil market eased somewhat. Overall, should the signals in the coming week become clearer, possibly showing a tightening of the US oil market we may see oil prices getting some support.
Easing financial conditions in the US may spur an increase in oil demand.
The Fed cut interest rates by 50 basis points during their monetary policy meeting on Wednesday. The 50 basis point cut, is the first rate cut to occur since 2020 and marks the beginning of the Fed’s rate-cutting cycle. Therefore, the implications of easing financial conditions in the US economy, could in turn translate to an increase in economic activity which in turn may increase energy consumption and thus oil demand.
In turn, the potential increase in oil demand may result in an increase of oil prices. However, should economic activity fail to increase and recession worries emerge, it may have the opposite effect and could instead weigh on oil prices. In conclusion, the apparent easing of the tight financial conditions surrounding the US economy may be seen as a positive signal for oil prices and thus may have aided the liquid gold’s price.
Iraq PM commits to OPEC quotas
Iraq’s Prime Minister on Sunday stated during his interview on Bloomberg that “we are committed to abide by the OPEC decisions and to preserve the price of oil in order to balance the interest of the users and the producers”. The assurances that Iraq would adhere to OPEC’s voluntary oil production cut, may have provided support for oil prices, as data had shown that Iraq’s production levels were not consistent with the cartel’s aims of reducing global oil supply in an attempt to shore up oil prices.
However, Iraq’s current commitment may be not of its own choosing, as a key oil pipeline in the country’s northern region remains closed over cost disputes. Nonetheless, the continued closure of the oil pipeline in combination with Iraq’s commitment to OPEC’s voluntary oil production cuts, may have aided oil prices.
China worries remain
According to a report by Reuters, a Chinese court on Tuesday ruled that two refineries own by state oil and chemical group Sinochem were bankrupt after failing to agree to a restructuring plan with creditors.
The two refineries are considered to be ‘teapots’ and together had a combined crude refining capacity of 3% of national refinery output. Hence, should the issue spread to other ‘teapots’ it may imply a significant weakening of oil demand in the Chinese market, which in turn may weigh on oil prices in the future.
Oil Technical Analysis
WTICash Daily Chart
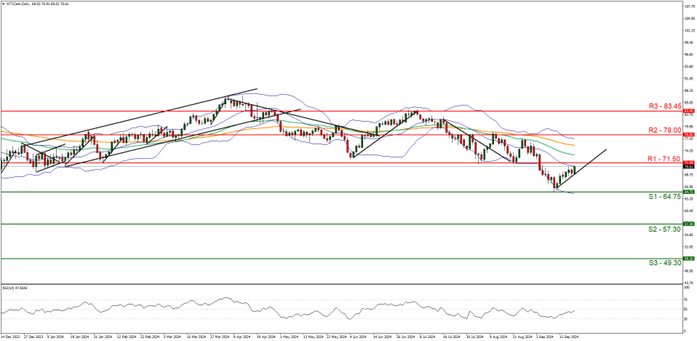
- Support: 64.75 (S1), 57.30 (S2), 49.30 (S3)
- Resistance: 71.50 (R1), 78.00 (R2), 83.45 (R3)
WTI’s price edged higher over the past week and now appears to be aiming for our 71.50 (R1) resistance line. We opt for a bullish outlook for the commodity and supporting our case is the upwards moving trendline which was incepted on the 11th of September, in addition to the RSI indicator below our chart which appears to have moved from near the 30 figure towards the 50 figure, implying that the bearish momentum may be fading away.
Nonetheless, for our bullish outlook to continue, we would require a clear break above the71.50 (R1) resistance line with the next possible target for the bulls being the 78.00 (R2) resistance level.
On the flip side for a sideways bias we would require the commodity to remain confined between the 64.75 (S1) support line and the 71.50 (R1) resistance level. Lastly, for a bearish outlook we would require a clear break below the 64.75 (S1) support line with the next possible target for the bears being the 57.30 (S2) support line.
إخلاء المسؤولية:
This information is not considered investment advice or an investment recommendation, but instead a marketing communication. IronFX is not responsible for any data or information provided by third parties referenced or hyperlinked in this communication.


