
WTI’s price seems to be moving in a relatively sideways fashion, with the commodity appearing to have erased last week’s gains. Today on the fundamental side, we take a look at the situation of the US oil market and then continue to examine the demand side as well as the supply side of oil, with a small reference to Exxon Mobil. The report is to be concluded with a technical analysis of WTI’s 4-hour chart.
Oil: Overview Report
US oil market loosens
In the US we note that the weekly EIA crude oil inventories figure came in higher than expected at 1.338M barrels. The higher-than-expected figure, showcases an increase in inventories, implying a reduction in demand for oil and as such has led to a higher inventories figure. The apparent reduction in demand, may have weighed on oil prices during yesterday’s trading session.
On the other hand, the API weekly crude oil inventories figure, indicated a greater drawdown than what was expected, thus contradicting the EIA crude oil inventories figure, for a lower-than-expected demand. Therefore, despite the disparity between the two figures, a greater emphasis appears to have been placed on the EIA figure, as it is released by the Government and as such, appears to have had a greater market impact.
On a separate matter, we also note that the US Strategic Petroleum Reserve (SPR) appears to be increasing since July 2023, with the last figure on the 5th of January noting that the SPR currently has roughly 355 million barrels of crude oil. Should the US continue refilling its SPR boosting oil demand in the US, it could provide support for oil prices over a longer period of time, whereas should it allow the SPR to be reduced it could weigh on oil prices. For now, our opinion is that the US may continue refilling its SPR, as it had neared critically low levels and could be deemed as a matter of national security for it to be refilled.
Exxon Mobil and Algeria
According to Reuters, Exxon Mobil (#XOM) is in talks with Algeria’s national state-owned oil company Sonatrach, regarding oil and gas exploration opportunities in the North African country. According to the report, Algeria’s oil production is at around 1 million bpd and as such, in the event of a deal being reached between Exxon and Algeria, it could open the door for Exxon to expand its operations into the oil-rich nation. As such, should a deal be struck, it could lead to investments being made in Algeria’s oil-extracting infrastructure, thus potentially increasing the supply of oil into the market, and in such a scenario, it could weigh on global oil prices.
The Red Sea issue is a thorn in global oil trade
On the supply side of the international oil market, we note that the initial market reaction from the reduced traffic in the Suez Canal appears to have been reduced, yet market worries for oil supply stemming from the Middle East continue to be intense. The continued uncertainty caused by increased instability in the region, could potentially provide support for oil prices, given that the Houthi attacks on shipping vessels navigating through the Red Sea continue to persist.
In particular, according to various media outlets, the Houthi rebels have attempted to strike US and UK naval vessels, a matter which appears to have angered the American and British Governments, with the British Secretary of Defence stating that “enough is enough”. The comments made may imply that the UK Government is preparing to strike the Houthi rebels, an escalation that could increase the already high tensions in the region and could potentially translate to higher oil prices, should further disruptions to the oil supply chain occur.
Oil: Technical Analysis
WTI Cash 4 Hour Chart
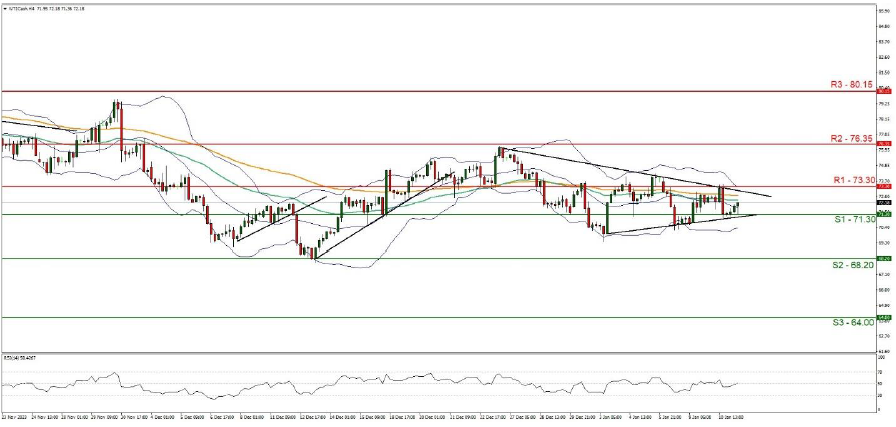
- Support: 71.30 (S1), 68.20 (S2), 64.00 (S3)
- Resistance: 73.30 (R1), 776.35 (R2), 80.15 (R3)
WTI’s price action appears to have moved lower since last week’s closing figure yet he overall picture of a range bound movement tends to persist. We maintain a sideways bias for the commodity and supporting our case is the RSI Indicator below our chart which currently registers a figure of 51, implying a neutral market sentiment.
Furthermore, the commodity appears to have formed a converging triangle, with the formation of a downward trendline since the 26th of December, whilst also having formed an upwards-moving trendline since the 3rd of January. In combination, the two trendlines appear to have formed the aforementioned triangle and as such, the commodity may move in a sideways fashion until a decisive breakout in either direction is noted.
Nonetheless, for our sideways bias to be maintained, we would like to see the commodity remain confined between the 71.30 (S1) support level and the 73.30 (R1) resistance line. On the other hand, for a bullish outlook, we would like to see a clear break above the 73.30 (R1) resistance line, with the next possible target for the bulls being the 76.35 (R2) resistance level. Lastly, for a bearish outlook to occur, we would like to see a clear break below the 71.30 (S1) support level, with the next possible target for the bears being the 68.20 (S2) support line.
إخلاء المسؤولية:
This information is not considered investment advice or an investment recommendation, but instead a marketing communication. IronFX is not responsible for any data or information provided by third parties referenced or hyperlinked, in this communication.


