

With the USD employment data for June still to be released as these lines are written we have a look the fundamental issues that affect oil prices, such as the data on the ground for the US oil market, the situation in the Middle East, with focus on Iran, as well as other issues affecting the demand and supply side of the international oil market. We are to complement the fundamentals with a technical analysis of WTI’s daily chart.
Easing of US oil market
The US oil market showed some signs of loosening up over the past few days yet let us dive into the details. On Friday the Baker Hughes US active oil rig count dropped from 438 to 432, the ninth time in a row that the number of active oil rigs is being reduced. Please note that the current level of active oil rigs has not been this low since early October 21, implying a reduced demand for oil in the US.
Yet on Tuesday, API unexpectedly reported an increase in US oil inventories. The increase was marginal and was for 0.680 million barrels, but still was indicative of oil production levels surpassing aggregated demand.
The notion of a loosening US oil market was enhanced also by EIA which also unexpectedly showed an increase of US oil inventories, this time not marginal, of 3.845 million barrels once again implying an easing of the US oil market, albeit also stating an increase of oil imports.
We note that the releases had no major effect on oil prices, yet should we see signs of the US oil market loosening further we may see them having a bearish effect on oil prices.
Iran’s nuclear program worries oil market participants
Iran continues to be in the epicenter of the market’s worries for the Middle East. Analysts highlighted as an issue for yesterday’s jump in oil prices the suspension of Iran’s cooperation with the International Atomic Energy Agency (IAEA). Iran’s President Masoud Pezeshkian, signed a law that suspends the cooperation, intensifying the uncertainty about the outlook not only of Iran as such but for the region as a whole.
On the other hand, the US despite some articles claiming that damage made by the US bombing of Iranian nuclear sites was limited, seems to be assured that the Iranian nuclear program was severely damaged.
It’s characteristic that the US Pentagon estimates that the Iranian nuclear program was set back by two years, implying that the operation was successful.
The issue as noted above tends to enhance uncertainty about the stability in the region and should we see further sanctions on Iran or in general an escalation of tensions, we may see oil prices getting more support as market worries for the supply side of the US oil market may intensify.
Supply and demand in the international oil market
In the US Reuters noted that gasoline demand dropped to 8.6 million barrels per day, prompting concerns about consumption in the peak U.S. summer driving season. On a deeper fundamental level, the market worries regarding the US trade wars, seem to remain weighing on oil prices.
It should be noted though that the US and Vietnam, have reached a trade deal yet on the flip side US President Trump’s 9th of July deadline is nearing and a number of trading partners of the US haven’t still reached a deal with the US.
Any signs of further easing of trading tensions could provide support for oil prices and vice versa. We also note that on the demand side of the international oil market, both the US and Chinese June PMI figures for the manufacturing sector rose beyond market expectations in a sign of improving manufacturing activity which could allow the demand side of the international oil market to expand further thus providing some support for oil prices.
Yet OPEC is also expected to raise production levels which may counter the support for oil prices. Please note that expectations are for OPEC to raise output by 411k bpd.
Oil Technical Analysis
WTI Cash Daily Chart
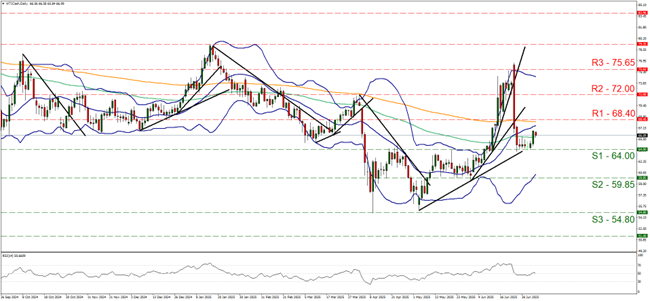
- Support: 64.00 (S1), 59.85 (S2), 54.80 (S3)
- Resistance: 68.40 (R1), 72.00 (R2), 75.65 (R3)
WTI’s price rose yesterday, placing some distance between itself and the 64.00 (S1) support line. Yet the bullish movement remains unconvincing for the time being and its characteristic that the RSI indicator rose yet remains close to the reading of 50, implying that market participants remain indecisive for the direction of the commodity’s direction. The Bollinger bands despite narrowing slightly are still pretty wide which may imply that the possibility of wider volatility is still present.
Hence we temporarily and cautiously switch last report’s bearish outlook in favour of a sideways motion bias. For a bullish outlook to emerge, we would require the commodity’s price to break the 68.40 (R1) resistance line clearly and continue higher to reach if not breach the 72.00 (R2) resistance level. On the flip side, for a bearish outlook to be adopted, we would require WTI’s price to break the 64.00 (S1) support line and start aiming for the 59.85 (S2) support level.
إخلاء المسؤولية:
This information is not considered investment advice or an investment recommendation, but instead a marketing communication. IronFX is not responsible for any data or information provided by third parties referenced or hyperlinked in this communication.


