
Gold’s price seems to be edging higher after bouncing off the level of $2155 per ounce since our last report, with the next potential target for the bulls being the precious metals all-time high figure of $2222 per ounce. Today we are to discuss the fundamental challenges laid ahead for the precious metal, while we will be concluding this report with a technical analysis of gold’s daily chart.
The Fed’s remains on hold
The bank last Wednesday, remained on hold as was widely expected, keeping rates at the 5.25-5.50% range. Thus, market attention appears to have turned to the accompanying statement, the new dot plot and Fed Chairman Powell’s press conference, as we had noted in last week’s report.
We note that the accompanying statement and Fed Chairman Powell’s press conference, appeared to have been hawkish, and in particular the comments made in the accompanying statement that “The Committee does not expect it will be appropriate to reduce the target range until it has gained greater confidence that inflation is moving sustainably toward 2 percent”, which may have contradicted market expectations of a more dovish tone, yet the new dot plot verified the market’s current expectations for a total of three rate cuts in the year which also tended to weigh on the USD and thus appears to have overshadowed the relatively hawkish remarks in the accompanying statement, thus weighing on the pound and allowing the precious metal to capitalize following its release.
Gold and US Yields
Since our last report, gold’s price edged higher, but so did the USD, which seems to have strengthened against its counterparts, thus highlighting a slight divergence between the two trading instruments. As such we turn our attention to the substantial decline of US yields since our last report which may have been an additional factor aiding to gold’s price, as they may have made US bonds a less attractive alternative to gold as an investment, which may have funnelled outflows from US Yields and inflows into gold given their inverse relationship with one another.
Upcoming financial releases
We highlight as the next big tests for the USD the release of the final GDP rate for Q4 on Thursday and the Core PCE price index for February next Friday and should the rates show a resilience of inflationary pressures in the US economy, they could provide some support for the USD, which in turn could weigh on the precious metal and vice versa.
Gold: Technical Analysis
XAUUSD Daily Chart
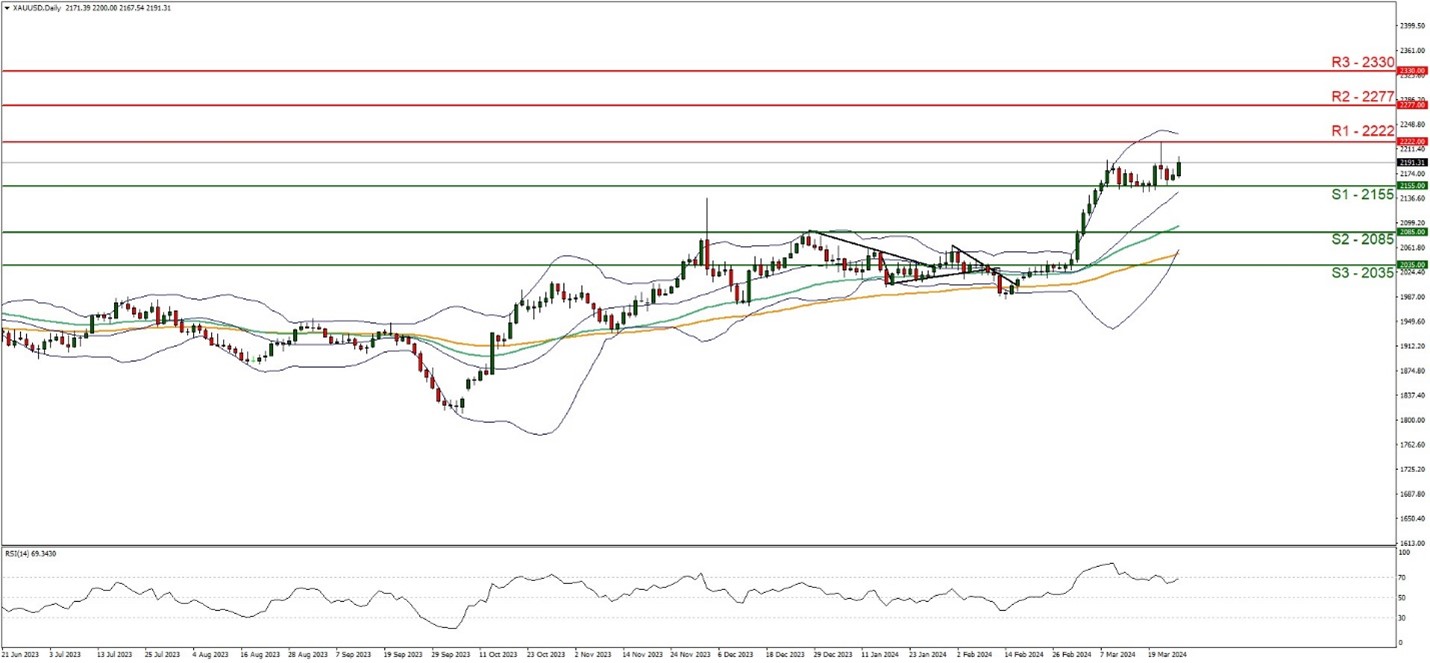
- Support: 2155 (S1), 2085 (S2), 2035 (S3)
- Resistance: 2222 (R1), 2277 (R2), 2330 (R3)
After our last report, gold’s price seems to continue to edge higher with the bulls seemingly now in control. We note that the RSI indicator has returned to the reading of 70, implying that the bullishness of the market has intensified. At the same time, we note that the leeway for the bulls that we had mentioned last week, appears to be in play with the bulls capitalizing on the space created between the upper Bollinger band and the precious metal’s price. Hence, for the time being, we tend to maintain a bullish bias for the precious metal.
For our bullish outlook to continue we would like to see a break above the all-time high figure at the 2222 (R1) resistance line, with the next possible target for the bulls being the 2277 (R2) resistance level. On the other hand, for a sideways bias we would like to see the precious metal remain confined between the 2155 (S1) support level and the 2222 (R1) resistance level. Lastly, for a bearish outlook, we would require a clear break below the 2155 (S1) support level with the next possible target for the bears being the 2085 (S2) support line.
إخلاء المسؤولية:
This information is not considered investment advice or an investment recommendation, but instead a marketing communication. IronFX is not responsible for any data or information provided by third parties referenced or hyperlinked, in this communication.


