
Gold at the time of this report, seems to be moving in an upwards fashion, compare to last week’s gold outlook, as market expectations of a pause by the Fed appear to be increasing, which may incentivize investors to re-allocate funds to the precious metal. In addition, we note that external shocks in the gold market, appear to have all but vanished, with financial releases stemming from the US to be in the spotlight. In this report, we aim to shed light on the catalysts driving gold’s price, assess its future outlook, and conclude with a technical analysis.
Gold Market Report
Dovish Fed?
The precious metal during today’s trading session, managed to print 6-month highs, as the market anticipation that the Fed may have reached its terminal rate appears to have been growing over the past week. The anticipation that the Fed may be done with rate hikes, appears to have aided gold’s ascent, given the precious metal’s inverse relationship with the greenback.
However, when we compare gold and the Dollar Index, it appears that their relationship may be disproportional, yet nevertheless still remains present. As such, despite optimism that the Fed may be done hiking interest rates, gold’s ascent may be attributable also to other factors explored in this report.
US Core PCE rates to drive gold’s direction.
This week is expected to have key financial releases from the US, in terms of the Core PCE rates which is the Fed’s favourite tool for measuring inflation. The Core PCE rates for October are expected to come in at 3.5%, which is lower on a year-on-year basis if compared to September, therefore the anticipation that inflationary pressures may be easing, could be pre-emptively generating market optimism that the Fed may be done raising interest rates. As such, should the expected Core PCE rate materialize or come in lower than expected, we may see gold capitalizing on a weaker dollar, whilst should it take market participants by surprise and accelerate, we may see gold weakening, as the greenback strengthens, given their inverse relationship.
Nevertheless, we would also like to remind our readers of the precious metal’s role, as an inflation-hedging instrument, which may distort its reaction to the financial release. Moreover, please note that the release of the US Revised GDP rate for Q3 is also due to be released earlier on in the week and may also enhance the negative correlation between the dollar and the precious metal.
First Batch of RBI’s Sovereign Gold Bonds Set to Mature on November 30th
According to the Economic Times of India, the first batch of Sovereign Gold Bonds (SGB’s) which were issued in November 2015, are set to mature on the 30th of November. According to the article, the return from the first issuance of the SGB’s is expected to be around 12%, which may spur increased demand for gold in the market and as such could push the precious metal’s price higher should we see a significant increase in demand.
However, for any material impact to occur on the price of gold, the interest by large institutions would have to be significant enough in terms of capital, which does not appear to be the case at this point in time. Nevertheless, we highlight this issue and traders may keep it in mind.
Gold – Technical Analysis
XAUUSD 4-Hour Chart
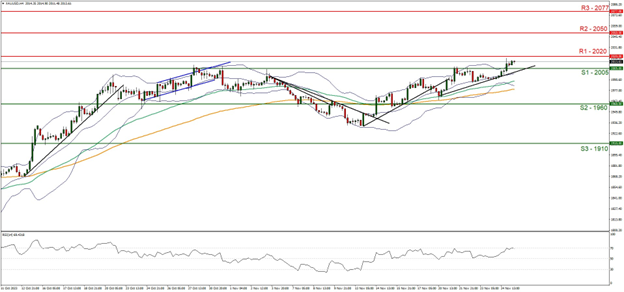
- Support: 2005 (S1), 1960 (S2), 1910 (S3)
- Resistance: 2020 (R1), 2050 (R2), 2077 (R3)
Since our last report, gold’s price appears to have moved in an upward fashion, having broken above resistance now turned support at the 2005 (S1) support level. We maintain a bullish outlook for the precious metal and supporting our case is the RSI Indicator below our 4-Hour chart which currently registers a figure near 70 implying a bullish market sentiment. Furthermore, our bullish outlook appears to be supported by the formation of an upwards moving trendline, which was incepted on the 20th of November. For our bullish outlook to continue, we would like to see a clear break above the 2020 (R1) resistance level, with the next possible target for the bulls being the 2050 (R2) resistance line.
On the other hand, the RSI being near the level of 70, may be implying that the precious is ripe for a market correction lower. As such, for a bearish outlook, we would like to see a clear break below the 2005 (S1) support level, with the next possible target for the bears being the 1960 (S2) support base. Lastly, for a sideways bias, which appears to be very unlikely as our S1 and R1 levels are fairly close to each other, we would like to see gold remaining confined between the 2005 (S1) support level and the 2020 (R1) resistance line.
إخلاء المسؤولية:
This information is not considered investment advice or an investment recommendation, but instead a marketing communication. IronFX is not responsible for any data or information provided by third parties referenced or hyperlinked, in this communication.


