
US Equities markets rose since our last report as all three major equities indexes S&P 500, Dow Jones and Nasdaq moved to higher ground, yet the S&P500 at the time of this report appears to be slightly in the reds for the week. In today’s report we are to examine fundamentals which may have affected US equities and conclude the report with a technical analysis of S&P 500’s daily chart.
US Sovereign credit rating gets taken down a notch to AA1 from AAA
Moody’s on Friday downgraded the U.S. sovereign credit rating, citing concerns over the nation’s growing $36 trillion debt pile. Moody’s stated on Friday that “Successive US administrations and Congress have failed to agree on measures to reverse the trend of large annual fiscal deficits and growing interest costs”. The announcement by Moody’s appears to have sent yields on Treasury bonds higher and raised market worries in the US Equities markets. Overall, the reduced confidence in the ability of the US Government and its mounting debt pile may have reduced confidence in the US economy and thus may have weighed on the US Equities markets following the announcement by Moody’s. However, in the same announcement the credit rating agency stated that “While GDP growth is likely to slow in the short term as the economy adjusts to higher tariffs, we do not expect that the US’ long-term growth will be significantly affected” implying that the negative implications on the US economy may be short term in nature and thus the negative implications on the US Equities markets may also be short lived as the long term growth outlook may not be significantly affected.
NVIDIA earnings next week
NVIDIA’s earnings are set to be released next Wednesday, the 28th of May, following the closing of the market. The earnings report will be for the fiscal quarter ending April 2025, essentially Q1 2025, with economists currently anticipating the EPS figure to increase slightly from $0.89 per share to $0.893 per share and the company’s revenue to increase to 43.12B from 38.3B. Thus both metrics could potentially aid the company’s stock price should they come in as expected or higher, whereas a lower-than-expected EPS and revenue figure could potentially weigh on the company’s stock price. Moreover, of interest may be the company’s earnings call, where market participants may be interested in the company’s AI commitments and their outlook for the rest of the year. Depending on the narrative emerging from the company’s earnings call, it could potentially aid or weigh on the company’s stock price.
التحليل الفني
US500 Daily Chart
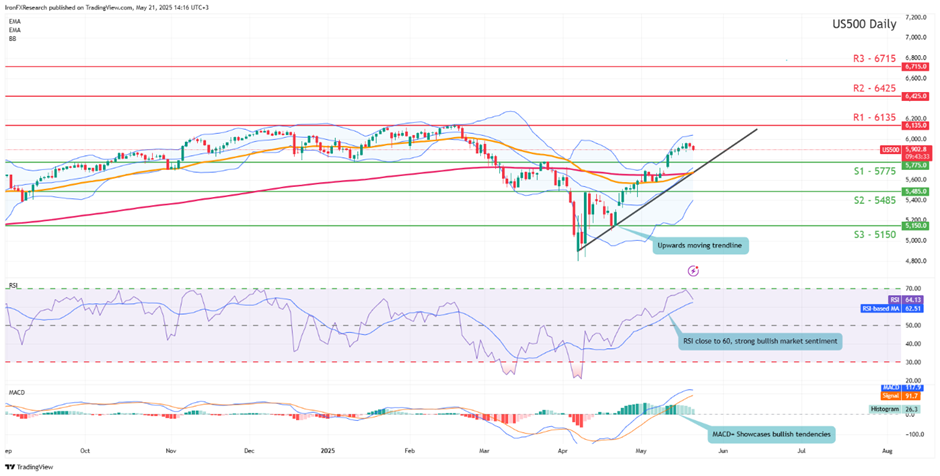
- Support: 5775 (S1), 5485 (S2), 5150 (S3)
- Resistance: 6135 (R1), 6425 (R2), 6715 (R3)
S&P 500 moved higher last week, but is currently in the red’s since the beginning of trading on Monday. We opt for a bullish outlook the index and supporting our case is the upwards moving trendline in addition to the RSI indicator below our chart which currently registers a figure near 60 implying a bullish market sentiment, in addition to the MACD indicator. For our bullish outlook to continue we would require a clear break above the 6135 (R1) resistance line, with the next possible target for the bulls being the 6425 (R2) resistance level. On the flip side for a sideways bias we would require the index to remain confined between our 5775 (S1) support level and the 6135 (R1) resistance line. Lastly, for a bearish outlook we would require a clear break below the 5775 (S1) support line with the next possible target for the bears being the 5485 (S2) support level.
If you have any general queries or comments relating to this article please send an email directly to our Research team at research_team@ironfx.com
إخلاء المسؤولية:
لا تُعد هذه المعلومات نصيحة استثمارية أو توصية بالاستثمار، وإنما تُعد تواصلاً تسويقيًا. لا تتحمل IronFX أي مسؤولية عن أي بيانات أو معلومات مقدمة من أطراف ثالثة تم الإشارة إليها أو الارتباط بها في هذا التواصل.


